Show metrics
From the main screen, you can select objects in a panel and click Show Metrics to see the graphs of those metrics for the given object(s), as shown in the following screen.
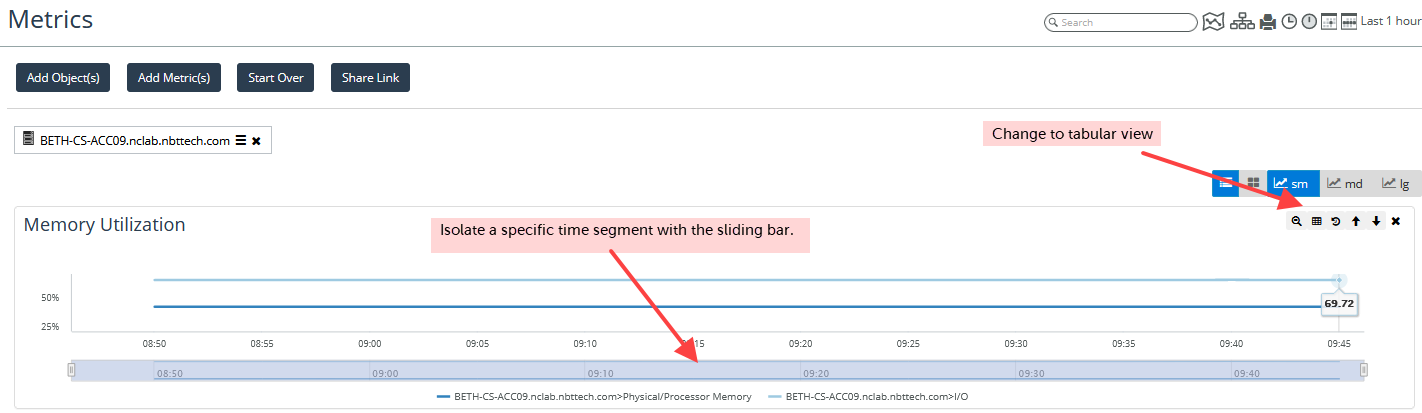
Show Metrics page
You can add Objects and Metrics to the display using the Add Object(s) and Add Metric(s) buttons:

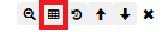
You can also select tabular view from the display icons
.
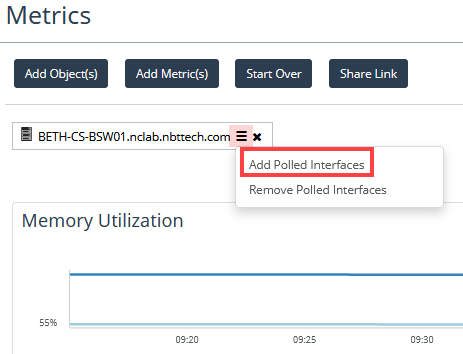
The Metrics page also gives you an option to add all of the polled interfaces for a device quickly. Choose the menu icon on a device, and select Add Polled Interfaces, as shown in the following screen.
Add Polled Interfaces option
A screen like the following appears.
Show Metrics page with polled interfaces
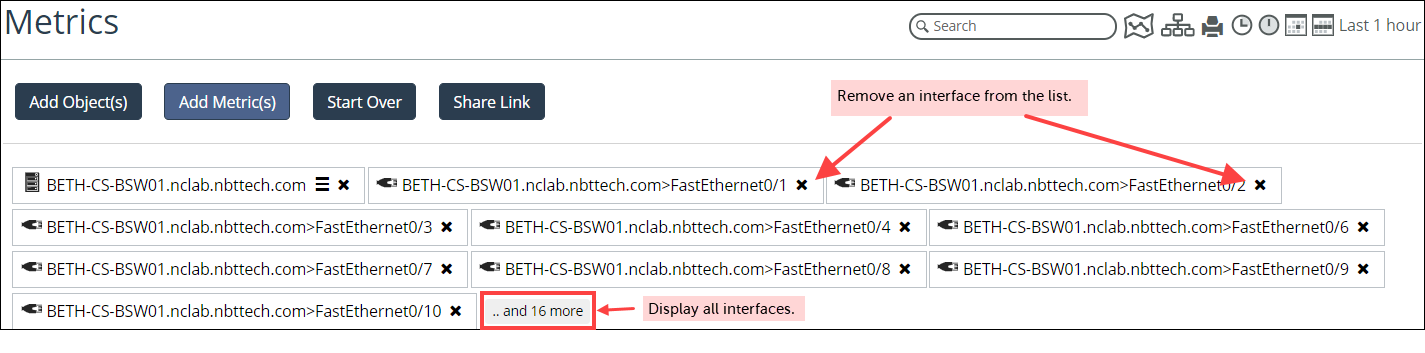
After you add polled interfaces, an icon for each interface appears at the top of the screen.
• To display all interfaces, click the and n more icon.
• To hide those interfaces once they are all displayed, click the Less icon.
• To remove a single interface and its metrics from the navigator, click the X on the icon.
• To close all interfaces, select the device and choose Remove Polled Interfaces from the action menu.
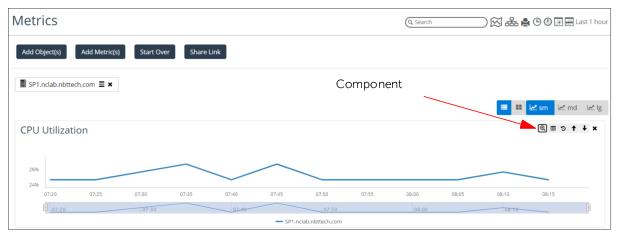
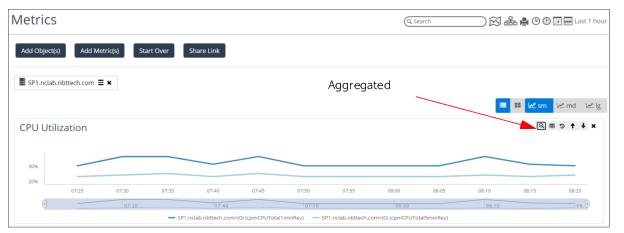
You can also graph metrics that contain multiple components as an aggregate average or graph each component individually. For example, you can view CPU Utilization for each CPU of the firewall named Firewall-PA-2020 or you can view CPU utilization as an aggregate average of all the CPUs. By default, the Metrics page will display in the individual component view.
You can toggle between the two modes using the

and

buttons, as shown in the following screens.
Aggregate mode
Component mode