Path monitoring
Application Network Path (AppNetwork Path) analysis is the calculation of the Layer-2 and Layer-3 path through the network between a given source-destination pair. The result includes detailed identification of each device and interface in that path to quickly troubleshoot whether network issues are a contributing factor or root cause of application issues.
NetIM’s Path Monitoring feature significantly enhances the existing AppNetwork Path analysis feature by adding:
• Scheduled polling of configured source-destination pairs
• Persistence of paths over time
• Equal Cost Multi-Path support
• Hop and path round-trip delay/latency support
• AppNetwork Path difference detection
• Historical path selection and visualization
• Enhanced AppNetwork Path visualization
– Multiple path display support
– Config change and round-trip delay/latency annotation on paths
– Show logical icons/device icons
– Play/Stop packet animation
– Show/Hide Connected hosts
– Show/Hide Interfaces
– Show Layer 3 Only
– Show/Hide Hop Delays
– Hops per line
– Geographic view
– All paths in Single View
• Path Monitoring metrics for alerting workflows
Configuring Path Monitoring
To configure Path Monitoring
1. Log in to the UI as admin.
2. Choose Configure > All Settings > Monitor > Path Monitoring.
3. To add a new monitored path, click Add in the upper left of the page.
4. Provide a name and description for the path, the endpoints you want to monitor and the frequency with which you want to perform the AppNetwork Path analysis.
5. When you are satisfied with your choices, click Submit.
Viewing and exploring monitored paths
All users have access to Path Monitoring viewing, navigation, and troubleshooting by choosing More > Path Monitoring.
Additionally, all users can save an AppNetwork Path definition but only users with administrator privileges can set up that path to be monitored over time.
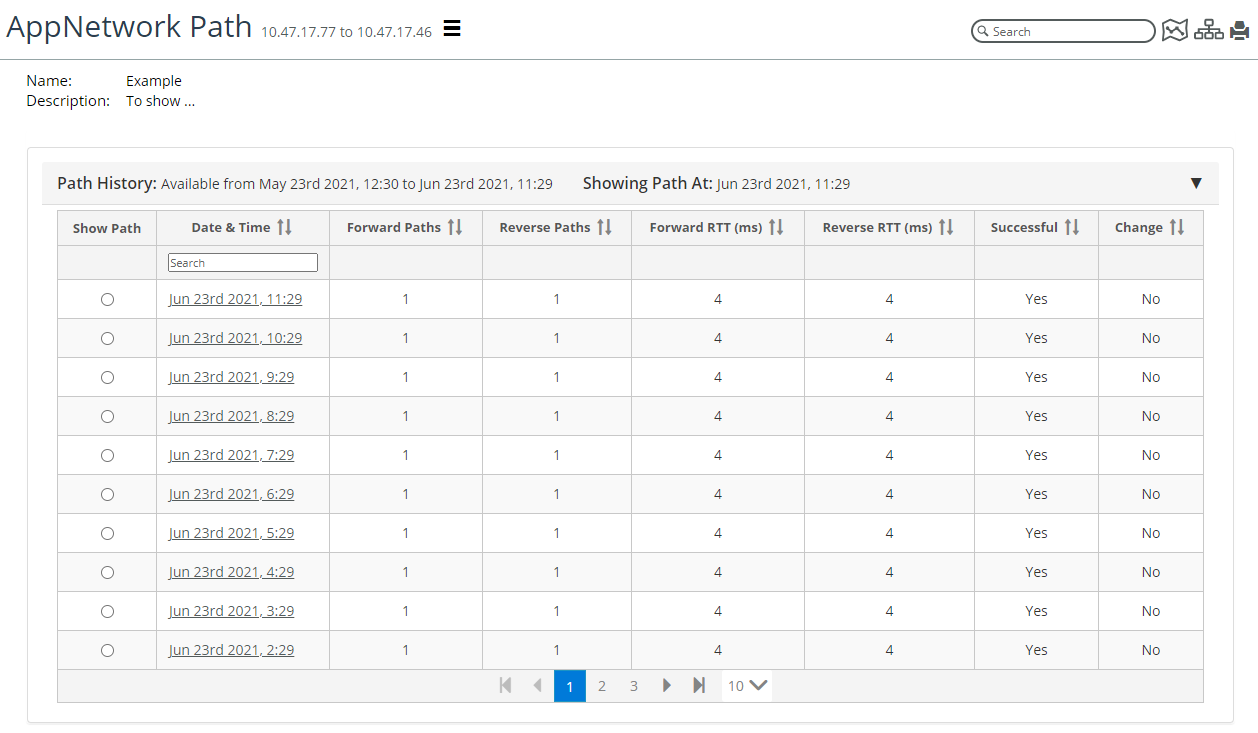
By clicking a path name, you can view the list of available historic paths. The Path History table displays important metrics about the number of forward and reverse paths, the maximum forward, and reverse round-trip times, and whether there was a path change detected from the previous path calculation, as shown in the following screen.
Path History table
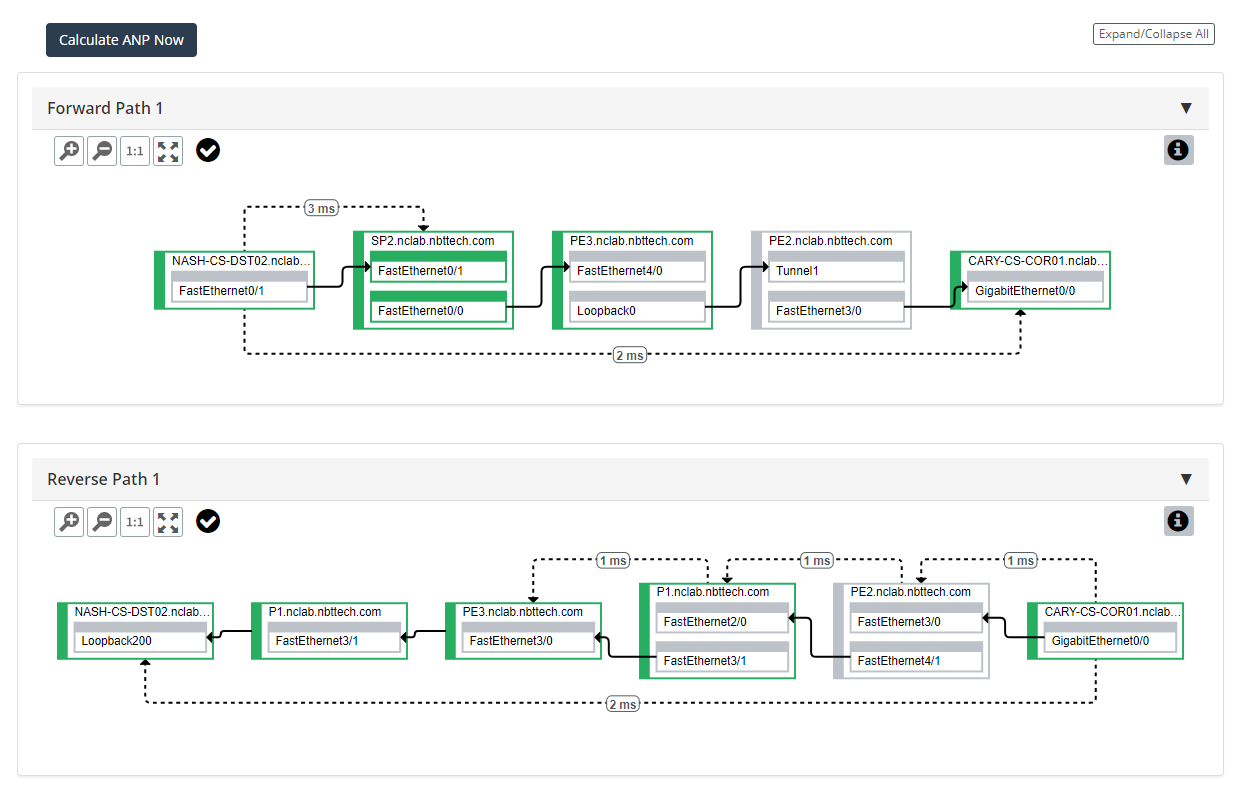
By default, when you click a path name from the Path Monitoring page, you are presented with the latest stored path in the path visualization section. You can select any historic path or click Calculate ANP Now to trigger a new AppNetwork Path calculation and display the results. The path visualization annotates the path with hop delays and path round-trip delays from when the path was calculated. Health indicators are provided and are the current health of the path element, as shown in the following screen.
Health indicators
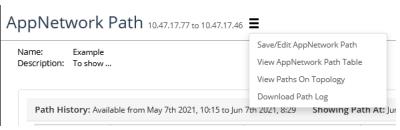
Using the action menu, you can make modifications to the monitored path name and path monitoring parameters or choose to download the AppNetwork Path log, as shown in the following screen. If you select Download Path Log, the AppNetwork Path session log for the displayed path will be downloaded to your browser as a text file. You can view the path log file off-line with any text editor or supply to Technical Support, if asked, as shown in the following screen.
AppNetwork Path log
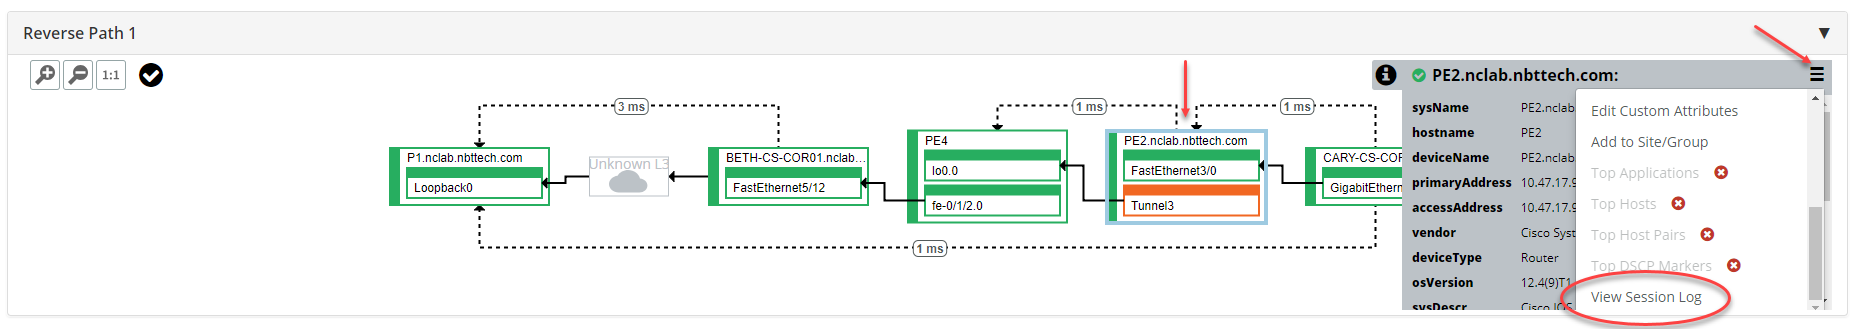
You can view per-hop session logs by selecting a specific device hop in the path view window and then, using the action menu in the information dialog, select View Session Log, as shown in the following screen.
Selecting View Session Log
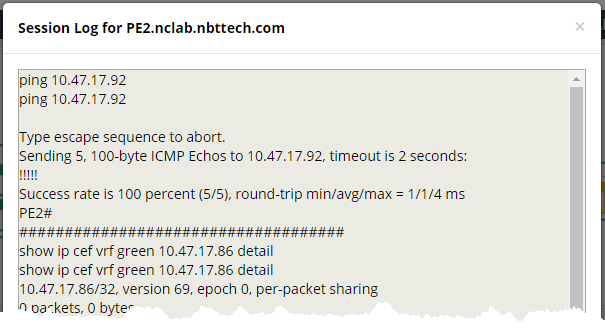
The session log for the selected hop will be shown in a pop-up window, as follows.
Session log pop-up window