The Home page and health
The NetIM Home page is your starting point when you log in to NetIM. Health for your monitored infrastructure is aggregated and reported using live charts. From these charts, you can drill down to get more granular information about the health of individual elements in your network. From the home page, you can quickly begin your monitoring and troubleshooting workflows.
The following is a partial list of what you can find on the Home page.
• What is the health status of my sites?
• How many and which devices are experiencing problems?
• Have any device configurations changed?
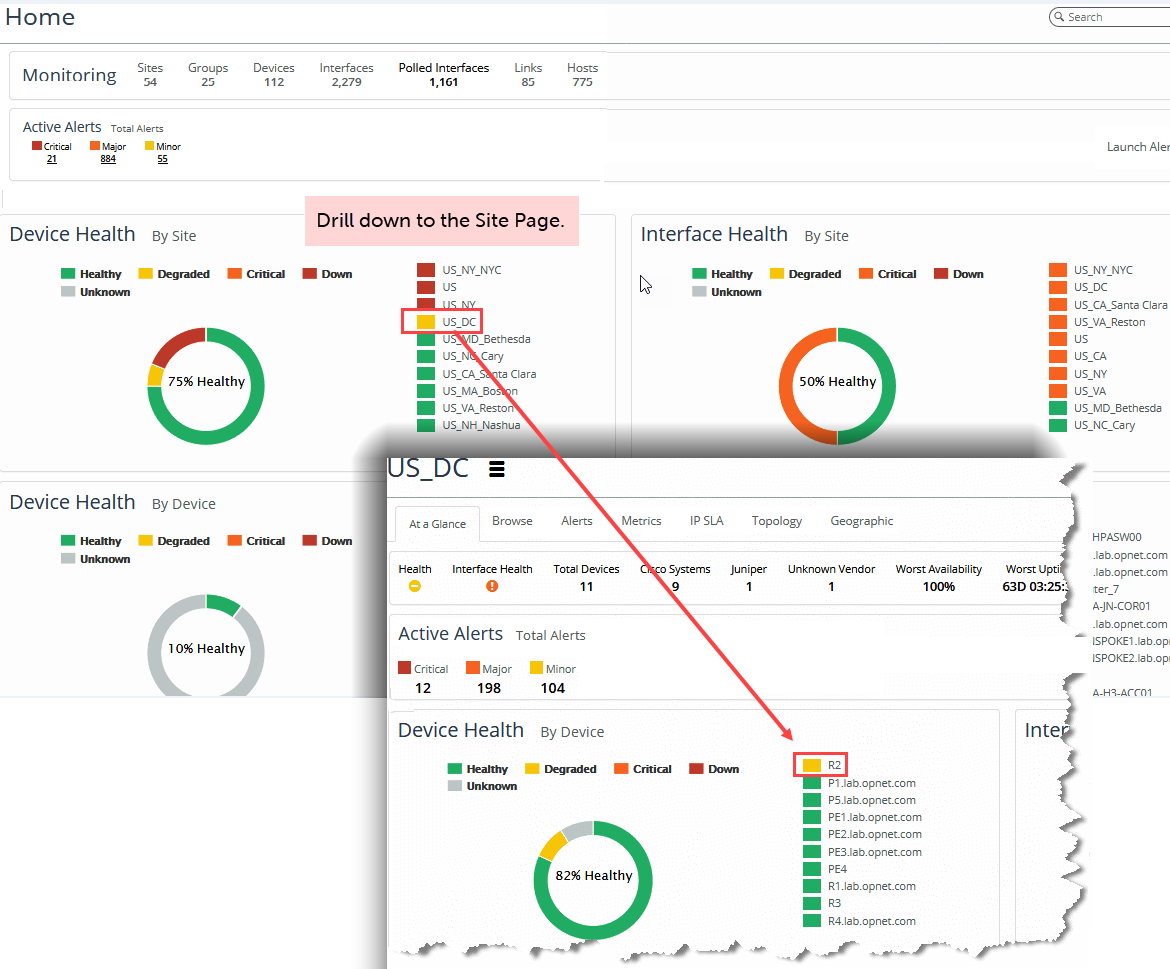
The following screen shows an example of a site in a degraded state (yellow coloring). Begin troubleshooting by drilling down to find out more information about the objects in this site. In this example, you click the site link for US_DC on the Home page, which takes you to the US_DC site page, where you see that router R2 is in a degraded state. The site inherits its health status from this degraded device.
Example of a site in a degraded state
Related topics