Configuring auto-baselining
Auto-baselining provides an easier configuration of alerting thresholds. You can configure the system to automatically determine threshold values based on historical values for selected metrics.
This feature provides:
• Simplification of the configuration process
– Example: It will no longer be necessary to create separate Alert Profiles to avoid generating alerts for devices that exhibit non-default metric values.
• Reduction of the number of alerts
– Example 1: Devices that always have high CPU utilization will not generate alerts.
– Example 2: Interfaces that are normally down will not generate alerts.
• Detection of unexpected changes
– Example: An interface that is normally down will generate an alert if it is now up.Auto-baselining features
Default Thresholds can be configured to use a specific algorithm for determining violations.
Editing algorithm selection in default thresholds
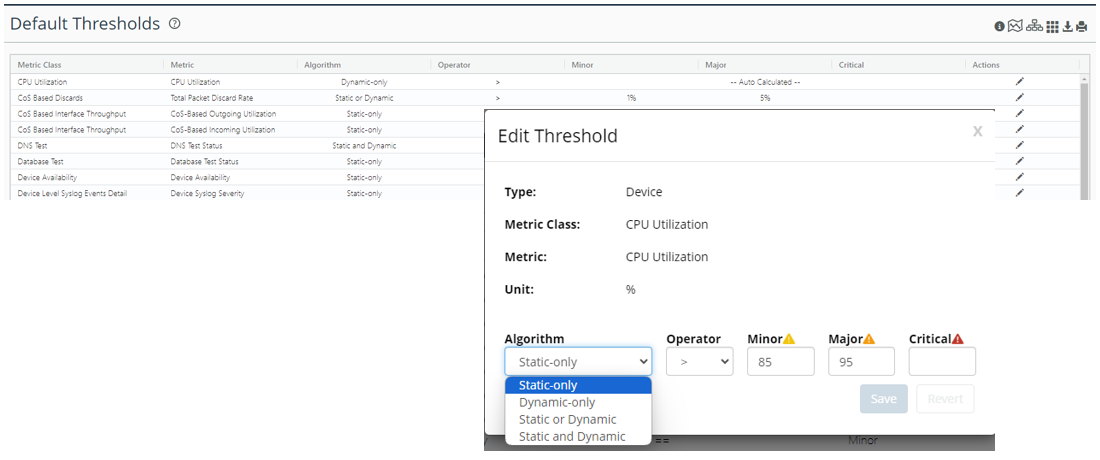
The following thresholding algorithms are supported:
• Static-only
– Legacy functionality.
– Metric values are compared to the explicitly specified threshold values.
• Dynamic-only
– Threshold values are automatically determined based on past values for the metric.
• Static or Dynamic
– If either the static or dynamic threshold is violated, then an alert will be issued.
• Static and Dynamic
– If both the static and dynamic threshold are violated, then an alert will be issued.
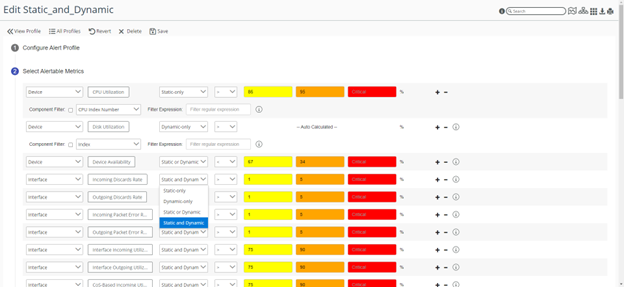
Individual thresholds in the non-default profiles can also be configured to use a specific algorithm.
Editing algorithm selection in individual thresholds
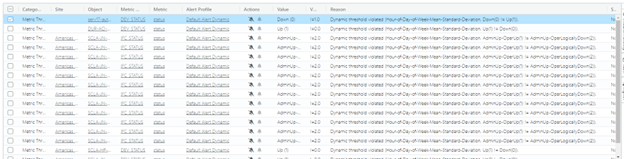
Detailed information about the reasons for an alert has been added to the Alerts page.
Reason column on Alerts page
Configuring auto-baselining
Significant changes have been made to the default thresholding and alert profile editing to support auto-baselining and both editors will use the same configuration rules.
Each threshold consists of:
• Algorithm
• Operator
• Explicit Minor, Major, and Critical Threshold values
While editing a threshold, the list of allowed operators changes depending on which algorithm is selected. The editors for the explicit threshold values is only shown if the choice of algorithm requires them. The default algorithm is Static-only.
Here is an explanation how the configuration works for each algorithm:
• Static-only
– Metric values will be compared to the values you specified for minor, major, and critical using the specified operator.
– For thresholding of enumerated type metrics, only the == or != operators should be used. Other operators are included only for backward compatibility.
• Dynamic-only
– Metric values will be compared to the automatically computed thresholds using specified operator.
The “!=” is a special case that will generate alerts if the metric value is above or below the expected value.
The severity of the alerts will be based on how far the metric value is from the expected value.
– For thresholding of enumerated type metrics, only the != operator is allowed and only “minor” alerts will be generated.
• “Static or Dynamic” or “Static and Dynamic”
– When the algorithm is set to “Static or Dynamic” or “Static and Dynamic,” the specified operator will be used for both types of comparisons:
Static: The specified operator will be used for comparison to the thresholds you specified for minor, major, and critical.
Dynamic: The specified operator will be used for comparison to the automatically computed thresholds.
– For “Static or Dynamic” and “Static and Dynamic” thresholding of enumerated type metrics:
Static: The specified operator will be used for the comparison.
Dynamic: The != operator will always be used regardless of which operator is specified.
Only the == or != operators should be specified. Other operators are included only for backward compatibility.
Auto-baselining configuration suggestions
The threshold configuration settings allow you to implement various strategies for generating alerts. Each algorithm has specific types of conditions that it can detect, and you can select different algorithms on a metric-by-metric basis to best meet your goals. Here are some general guidelines:
• Static-only
– Suitable for alerting on tangible resource depletion and persistent conditions.
– Example: Detecting disk utilization increases to a high level or stays at a high level.
• Dynamic-only
– Suitable for alerting on any anomaly while disregarding persistent conditions.
– Example: Detecting interface status changes while ignoring interfaces that are always down.
• Static or Dynamic
– Suitable for alerting on even minor anomalies while also alerting on persistent conditions.
– Example: Detecting moderate changes in interface utilization and detecting interface utilization that is currently high.
• Static and Dynamic
– Suitable for alerting on major anomalies while ignoring persistent conditions.
– Example: Detecting bursts in CPU utilization to high level but ignoring CPU utilization if it is always high.
In general, the “Static and Dynamic” algorithm will lead to the fewest alerts since both the static and dynamic thresholds need to be exceeded for an alert to be issued. A list of suggested settings for each metric is given in the next section.
Auto-baselining experimentation
For you to get experience with how auto-baselining will work in your environment, we recommend that a trial configuration be used first. After verifying that the new configuration is working as expected, the trial configuration can be put into full operation.
The following procedure will guide you through the process.
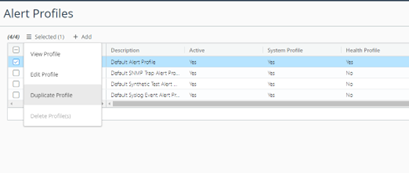
1. Duplicate the Default Alert profile.
Duplicate Profile option
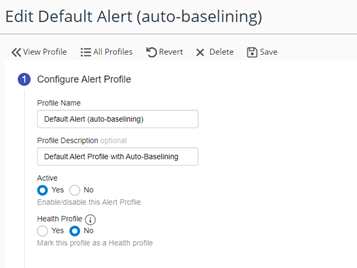
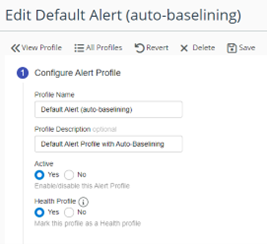
2. Name it appropriately and make it Active.
Alert Profile activation
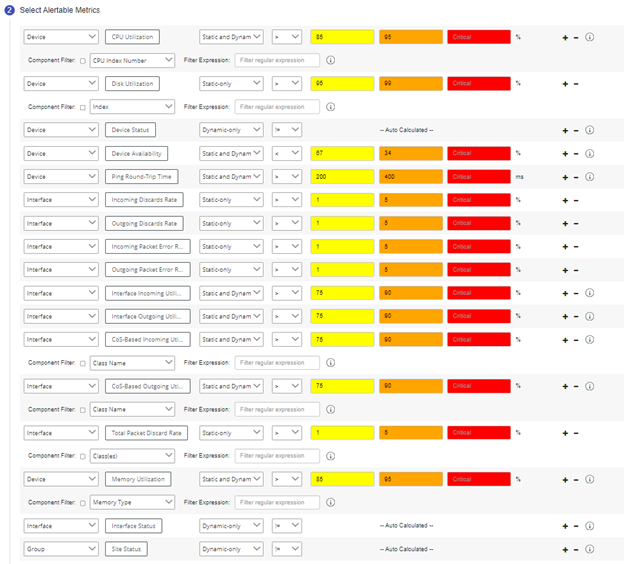
3. Change the algorithm selection as desired to use auto-baselining. The following figure shows the recommended algorithms, operators, and thresholds for each metric.
Suggested algorithm selection for auto-baselining
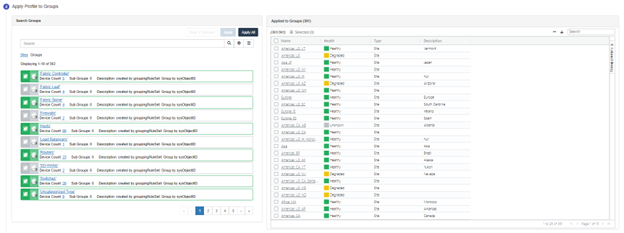
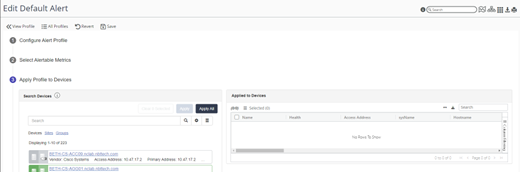
4. Add all the devices and groups to the new profile.
Adding devices to new profile
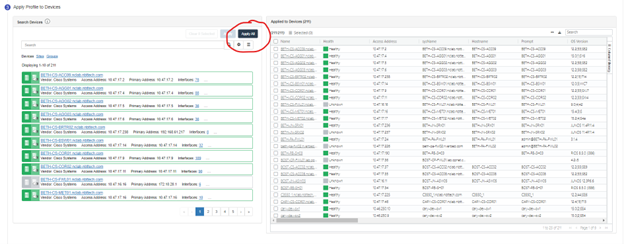
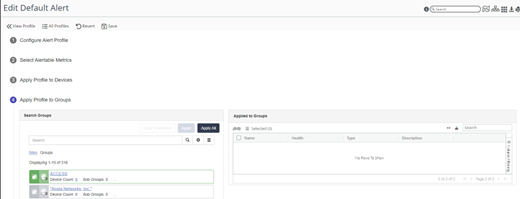
Adding groups to new profile
5. Optionally, disable the notifications for the auto-baselining profile.
6. Save the changes to the auto-baselining profile.
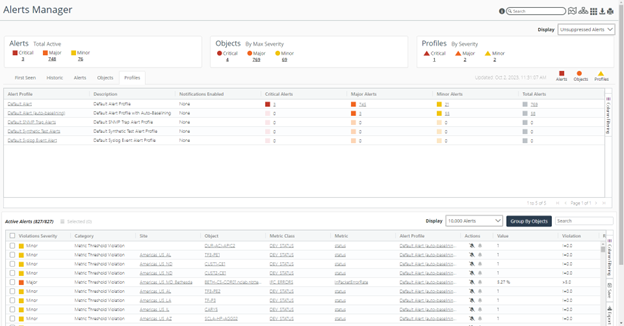
7. Compare alerts generated by the auto-baselining profile with the alerts generated by the default alert profile over the next few days.
– There will be fewer alerts for the auto-baselining profile since it does not generate alerts for persistent conditions, such as a device or interface that is always down.
Default alerts for auto-baselining
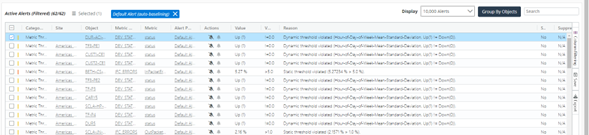
– The list of Active Alerts can be filtered to display only the alerts generated by the auto-baselining profile by clicking the Total Alerts value for the auto-baselining profile (58 in the screen shot above).
– Examine the Reason field of the Active Alerts table to see explanations of why alerts were issued.
Reason column of active alerts table
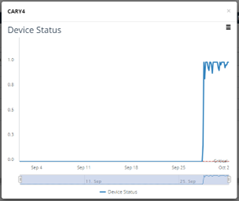
– Clicking the Metric value of any row in the table will show values of the metric at the time that the threshold violation was detected. In the example below, a device that was normally down is now up and an alert was issued.
Default alert metric
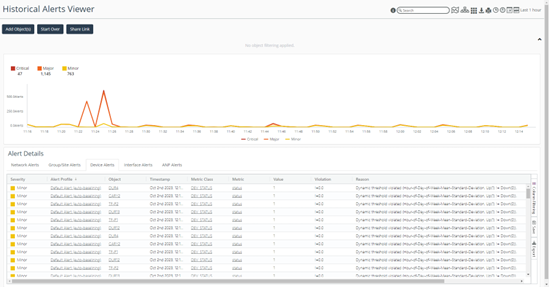
– The Historical Alerts Viewer can also be used for verifying the alerts generated by the new profile.
Alerts on Historical Alerts Viewer page
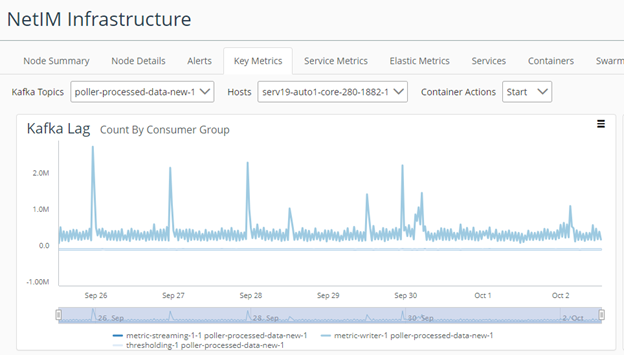
8. Since enabling auto-baselining does put added load on the system, you need to verify that it is still functioning properly. The simplest way to check for auto-baselining overloading the system is view the Kafka lag for the “poller-process-data-new-1” topic. This can be found on the NetIM Infrastructure page. Verify that the values of the lag are not increasing over time.
Kafka lag on NetIM Infrastructure page
9. After verifying that the system is performing well with the auto-baselining profile, configure it to be the active profile:
– Remove devices from the Default Alert profile (static thresholding).
Removing devices from default alerts
– Remove groups from the Default Alert profile (static thresholding).
Removing groups from default alerts
– Save the changes to the Default Alert profile.
– Configure the auto-baselining profile as the health profile for the system.
Health Profile configuration
– Optionally, reenable the notifications for the profile.
10. Verify that the system is still performing well.
– Verify the number of alerts.
– Check the device and interface health.
If this is a brand-new installation, there will not be historical data to use for calculating thresholding dynamically. However, the system will get better at determining these thresholds as time goes by and more historical data is available.
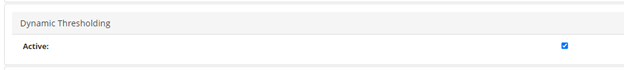
Dynamic thresholding general setting
NetIM has a mechanism to quickly disable all dynamic thresholding. You can use this command if:
• there are many alerts generated by the dynamic threshold and you just want to quickly remove them.
• the system appears to be overloaded by the amount of additional processing due to the dynamic thresholding.
To access the setting go to CONFIGURE > All Settings > General Settings and uncheck the Dynamic Thresholding check box.
Dynamic thresholding setting