Introduction to the NetIM Home page
The Home page provides a high-level summary of the health of your network. The following figure shows an example of the NetIM screen for an administrative user. From this page, you can start any workflow, including:
• drilling down to more information about the health and status of devices in your network.
• launching a number of other options, such as the Topology Viewer, from the menu bar.
• changing the time window of data displayed on this page.
For information about adding and configuring panels on the Home page, see
Working with Custom Views.
NetIM Home screen for an administrative user
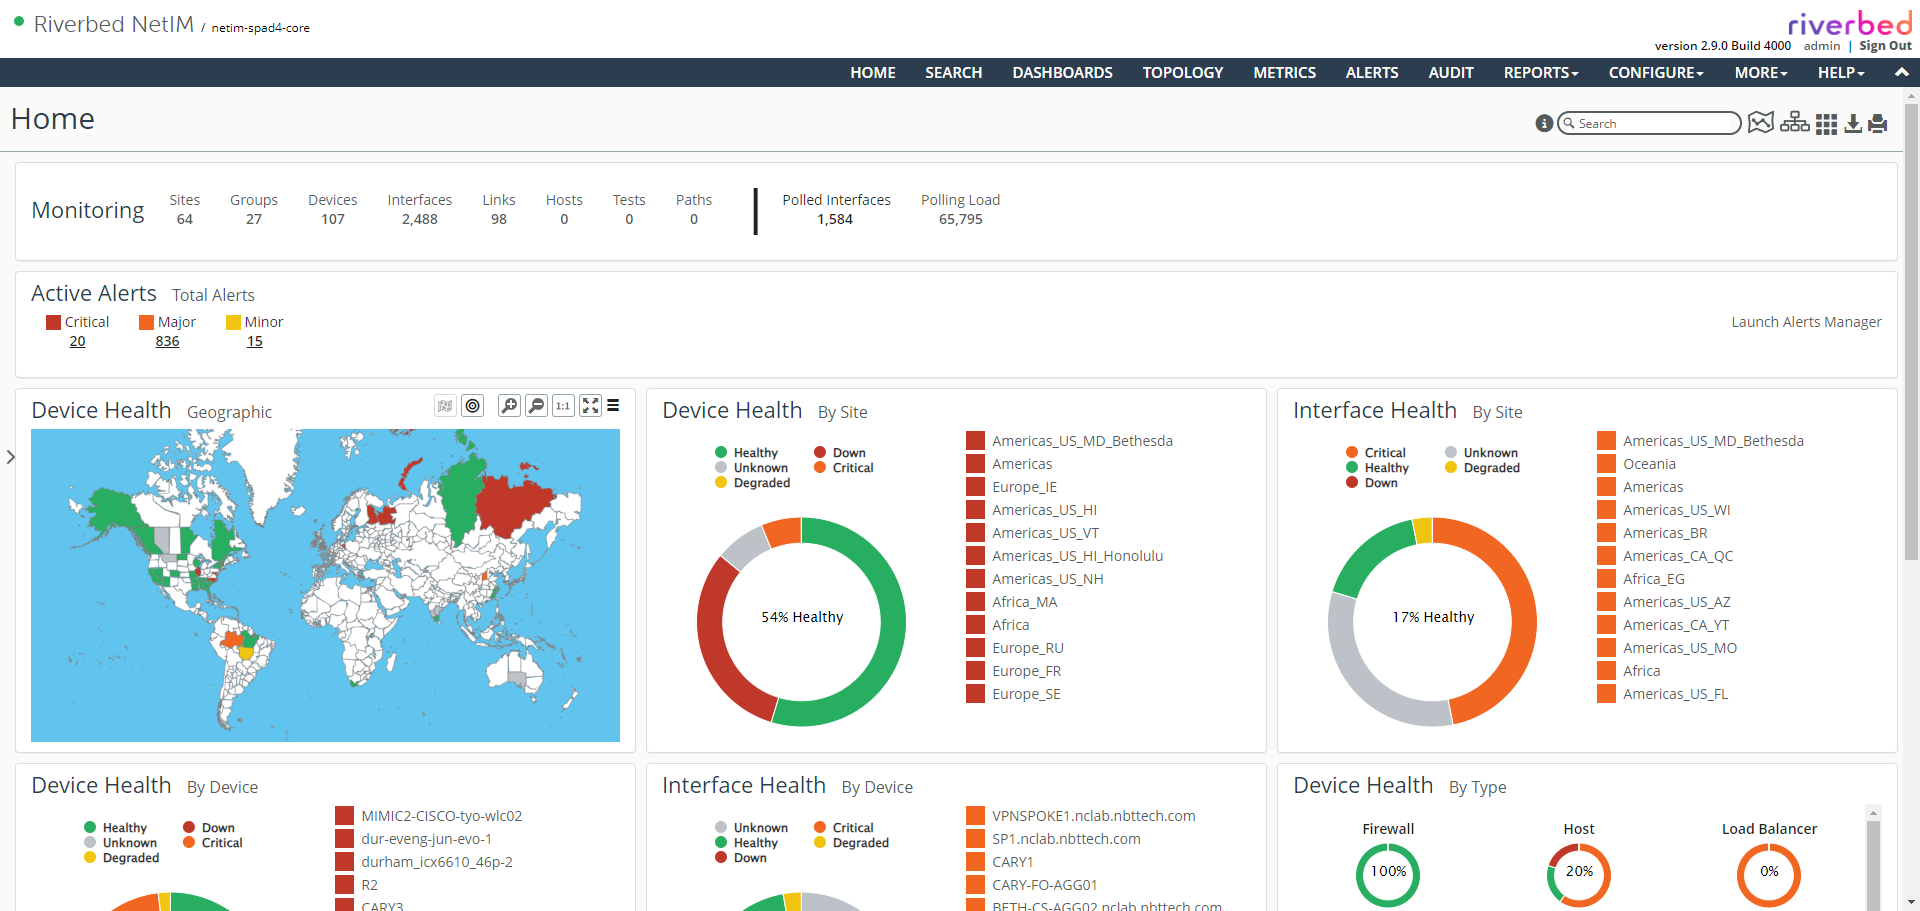
To drill down for detailed status, click a slice of the circle graph or a square status indicator or an area in the Geographic panel. You can also click a circular status indicator to remove it from the circle graph.
Additionally, you can get mouse-over status on the Geographic panel and graphs.
Also, you can click the Launch Alerts Manager link in the right corner of the Active Alerts frame to bring up the Alerts Manager page.
For more information about working with the Home page, see
Monitoring the Health and Status of Your Infrastructure.