Viewing test results on the Test Details tab(s)
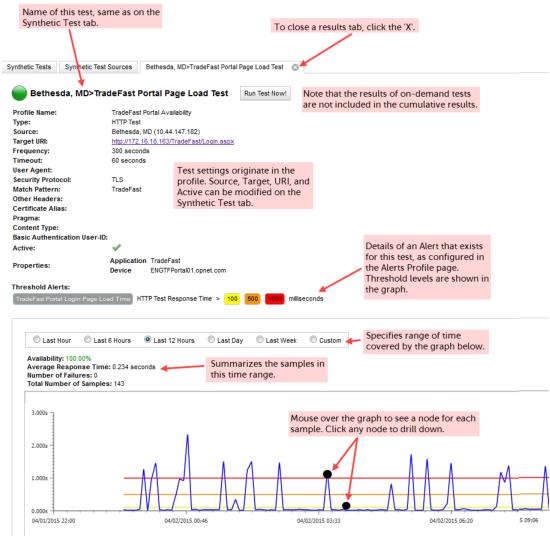
To view test results, select a test, and then select Quick View in the action menu.
A pop-up window appears with the test results, as shown in the following screen.
Viewing the Synthetic Test details
Drilling down
When you click a node on the results graph (as in
Figure: Viewing the Synthetic Test details), the next panel depends on the currently selected time range:
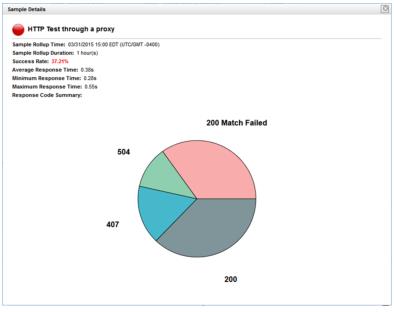
• If the selected time range is Last Hour, Last 6 Hours, Last 12 Hours, or a Custom range that covers less than a day, the Sample Details page appears (as in
Figure: Viewing the Synthetic Test details) with the logged output of a single sample.
Sample Details page when Time Range >=1 Day (for an ‘HTTP Test’)