Site view
A site-curated view focuses on a single site and presents information about what is being monitored, what has changed, and the overall health of the site. From this view, you can drill down for more information, or you can explore the information on each tab to see what this site comprises and to look at the metrics collected.
The information and health for a site are products of aggregated information from devices, interfaces, sub-sites, and groups that are part of the site.
Site view
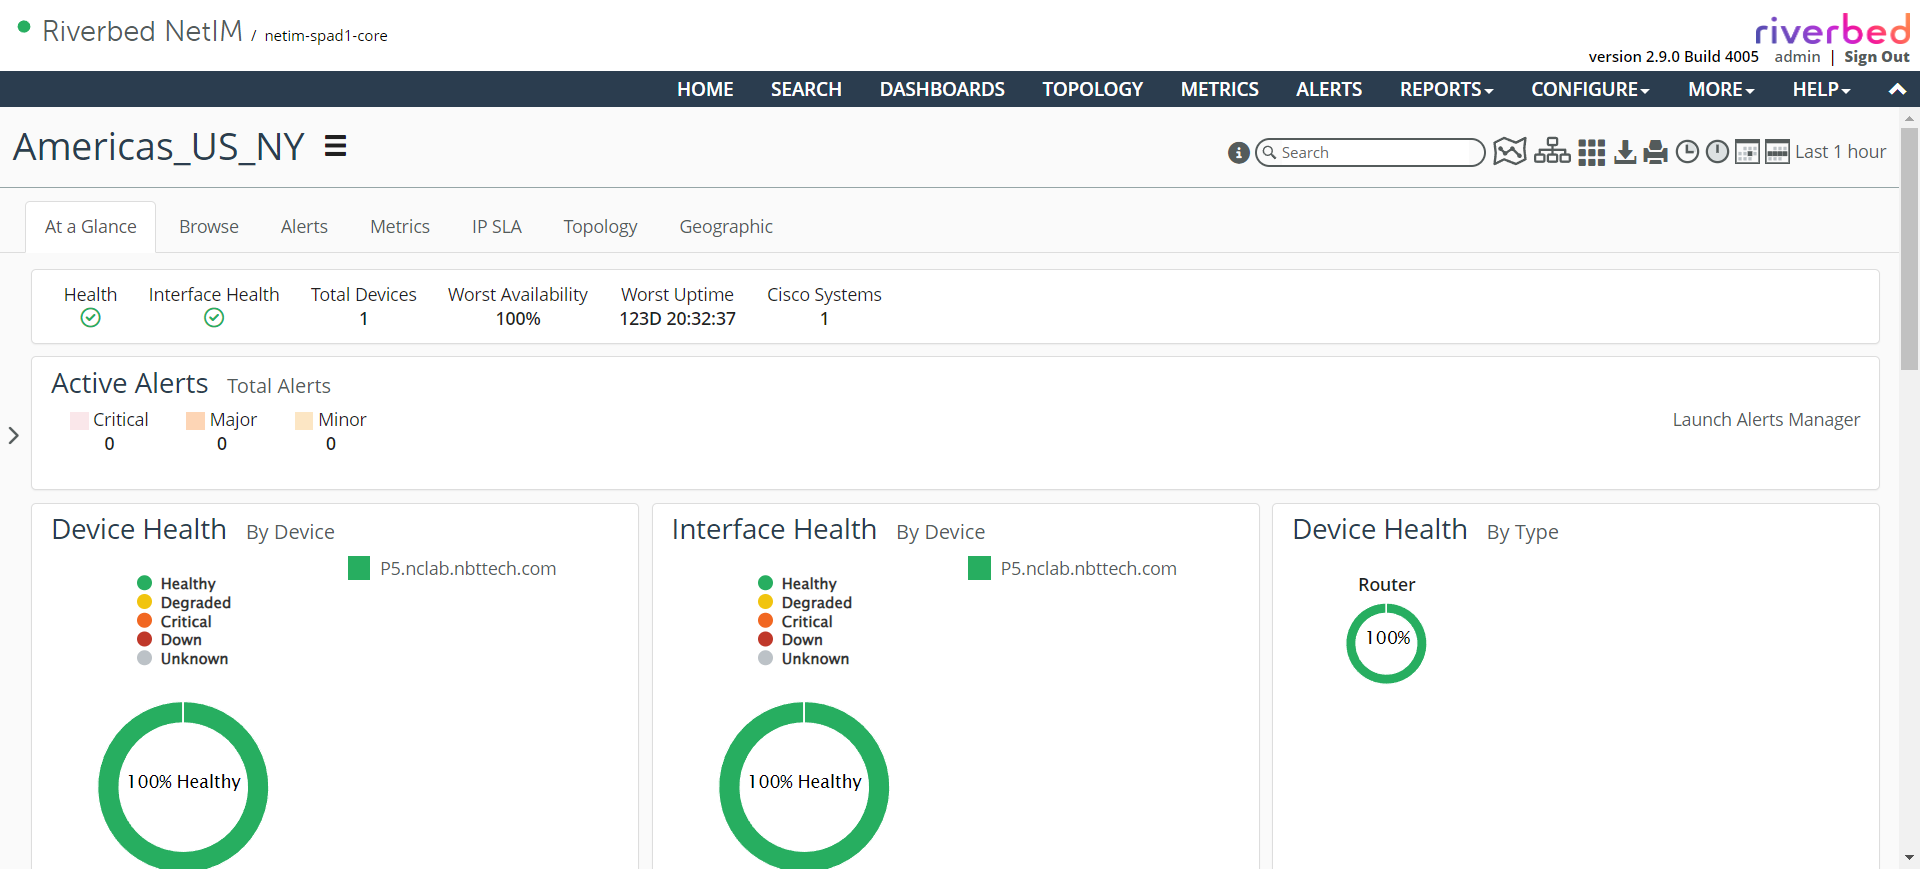
The following panels are displayed by default:
• Device Health – By Device
• Device Health – By Type
• Interface Health – By Device
• Top Interfaces – Utilization
• Top Interfaces – Packet Error Rate
• Top Interfaces – Packet Discard Rate
• Configuration Changes
• NetAuditor Policy Violations – Count
• Synthetic Tests – By Test Type
The following panels can be added to a site view:
• Data
– Metric Chart
– Riverbed NetProfiler
– Top/Bottom N Metric Chart
– Top/Bottom N Metric Bar Chart
– Metric Period Summary
– Metrics Table
– Enumerated Time Series
– Gauge
– Metric/Attribute Value
– Attributes
• Summary
– Health Summary
– Configuration Changes
– Configuration Changes – Bubble Chart
– Time-Based Metric Summary Bubble Chart
– Health Summary by Device Type
– Synthetic Tests by Test Type
– Navigator Tree
– Site Health Sunburst
– Org Policy Violation Table
– Org Policy Violation Summary
• Maps
– Topology
– Geographic Health
• Banners
– Summary
– Alert Summary
– Header/Separator