Using the Alerts Manager
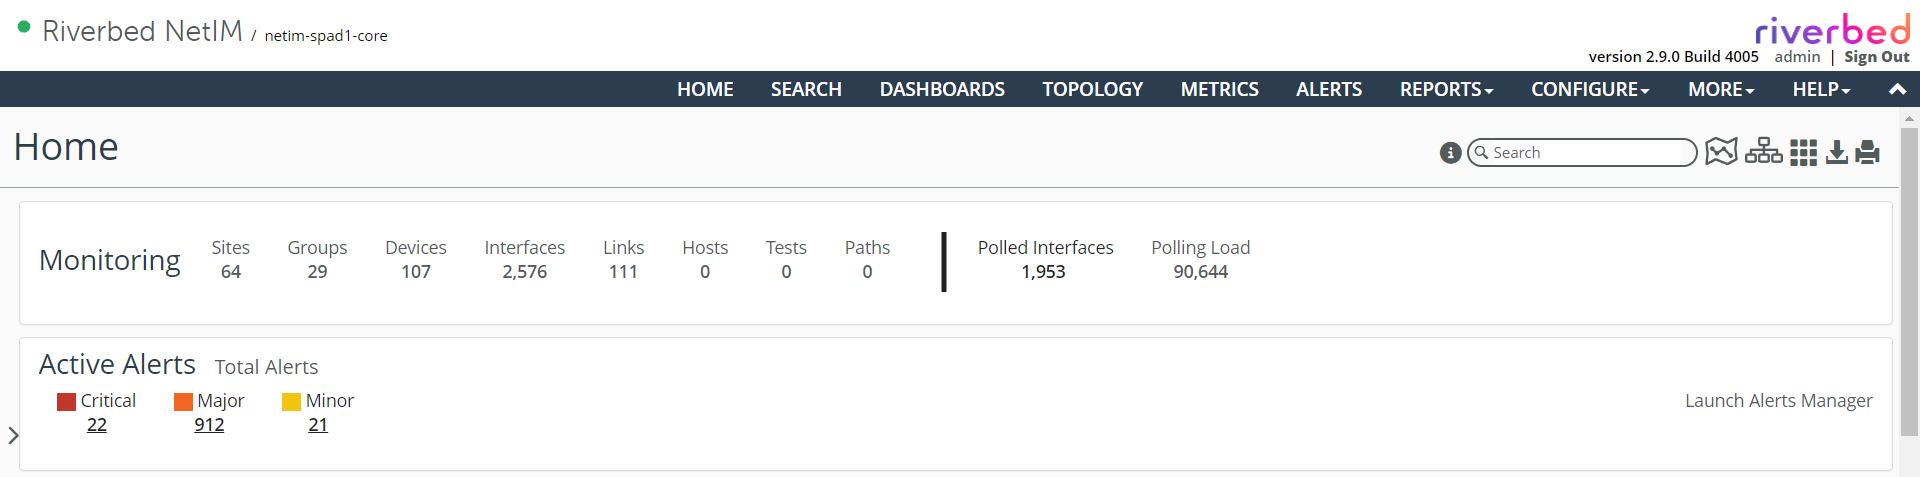
The Alerts Manager is accessed from the main menu bar, from the Launch Alerts Manager link on the Home page and object pages, and from the Alerts tab on every object page, as shown in the following screens.
Accessing the Alerts Manager
When invoked, the Alerts Manager page displays as shown in the following screen.
Alerts Manager page
The Alerts Manager consists of three main sections:
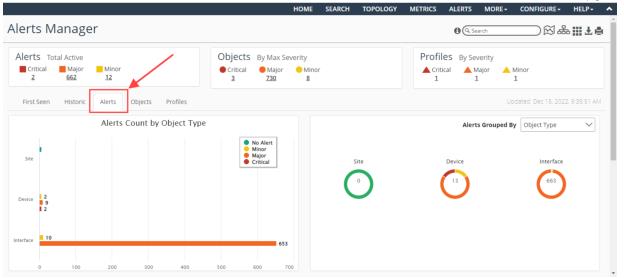
• Active Alerts Summary Frame—Provides a summary of total active Critical, Major, and Minor Alerts, Objects, and Profiles by severity, as shown in the following screen.
Active Alerts Summary

Clicking the Alerts, Objects, or Profiles totals populates the
Active Alerts Table with only those active alerts to focus your troubleshooting. You can also view Active Alerts Counts historically over time and view when Alert threshold violations were first seen or triggered.
• Tabs Frame—Provides these distinct ways of viewing alerts:
– First Seen Tab (default)—Displays current active alerts by time first seen.
– Historic Tab—Displays alert history for the last hour, day, week, and month.
– Alerts Tab—Displays alert count by object type and alerts grouped by object type, metric class, and metric name.
– Objects Tab—Displays the active alert counts aggregated to objects that are affected. You can view how many sites, devices, and interfaces are affected. You can also view where the active alerts are geographically occurring.
– Profiles Tab—Displays which Alert Profiles are responsible for the threshold crossings. If you create alert profiles for specific regions, device classes, or device types, then the Profiles tab can help you understand where and what issues are occurring and to what device types.
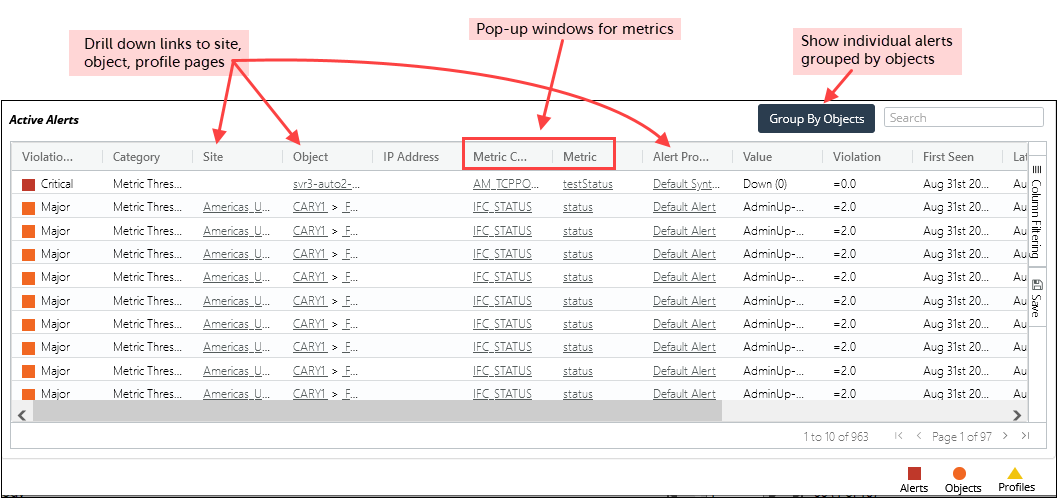
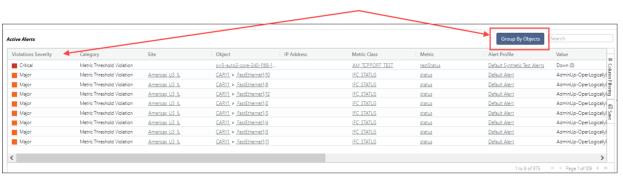
• Active Alerts Table—Provides a tabular listing of all active alerts in descending order, as shown in the following screen.
Active Alerts table
– The display can be toggled between Show Individual Alerts (default) and Group by Objects, as shown in the following screen.
Group by Objects view
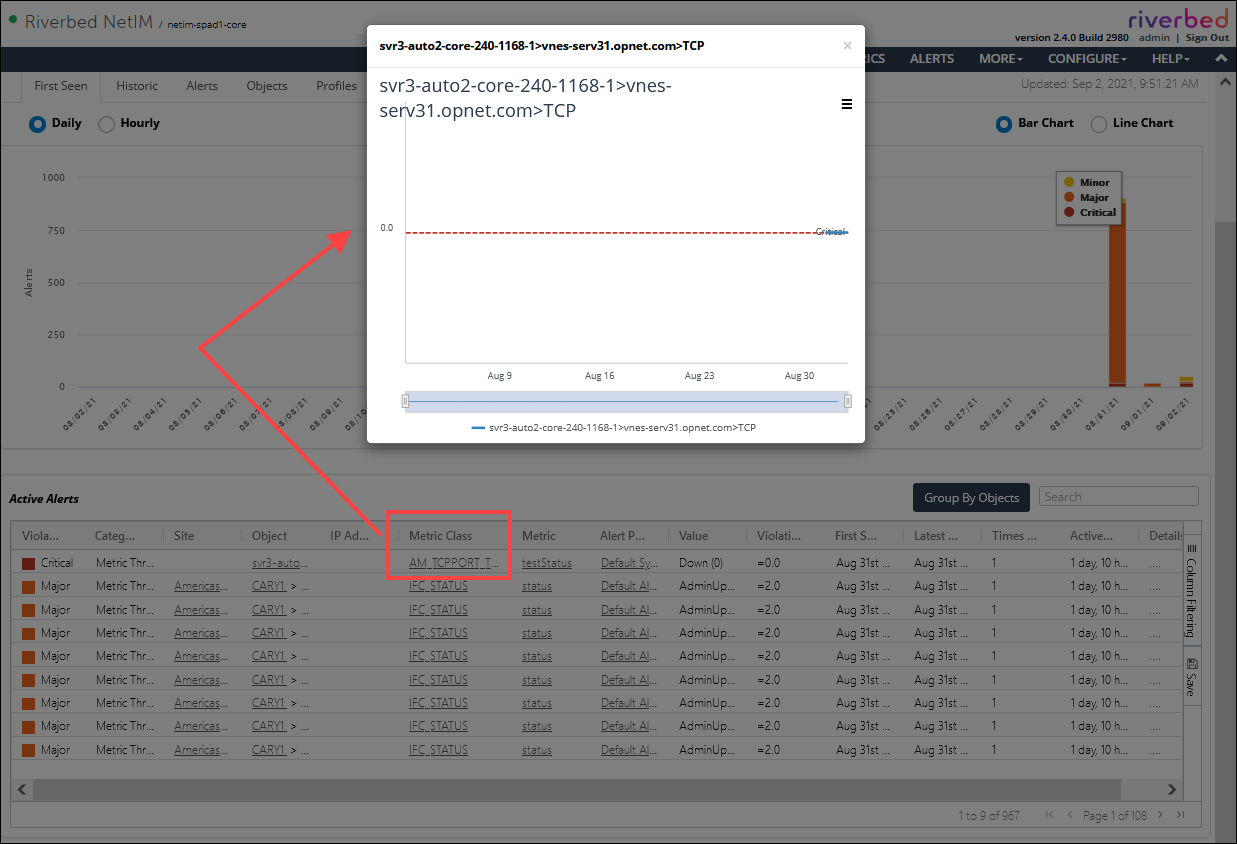
– In the Show Individual Alerts view, the Site, Object, and Alert Profile columns provide links that take you to the associated pages for those alert, and the Metric Class and Metric columns provide links that display a pop-up with a quick view of the metric over time, as shown in the following screen.
Metric Class with a view of the metric over time
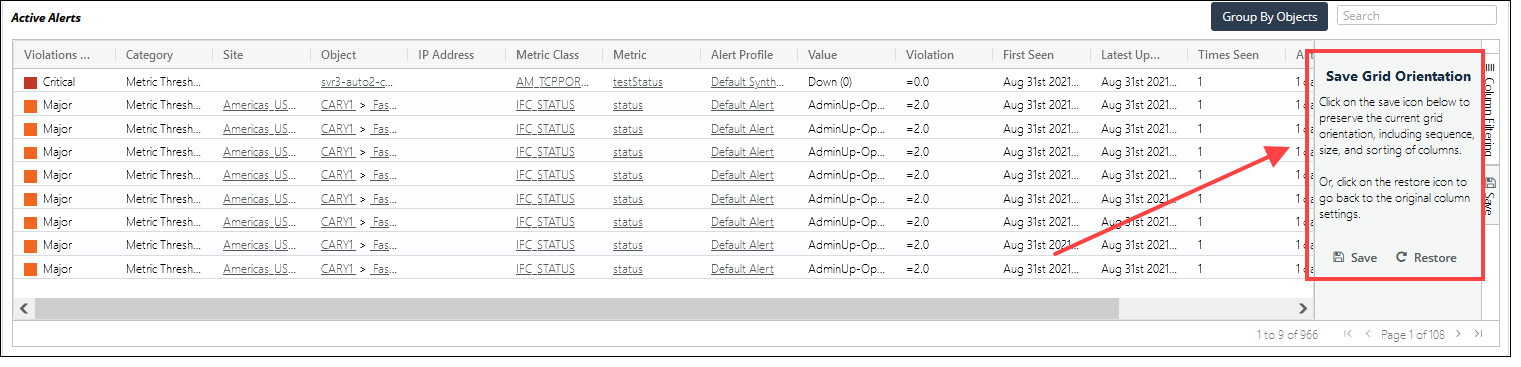
– Once you have selected the columns you want to display, you can save these settings by clicking the Save icon in the far right of the Active Alerts frame, as shown in the following screen.
Saving the settings
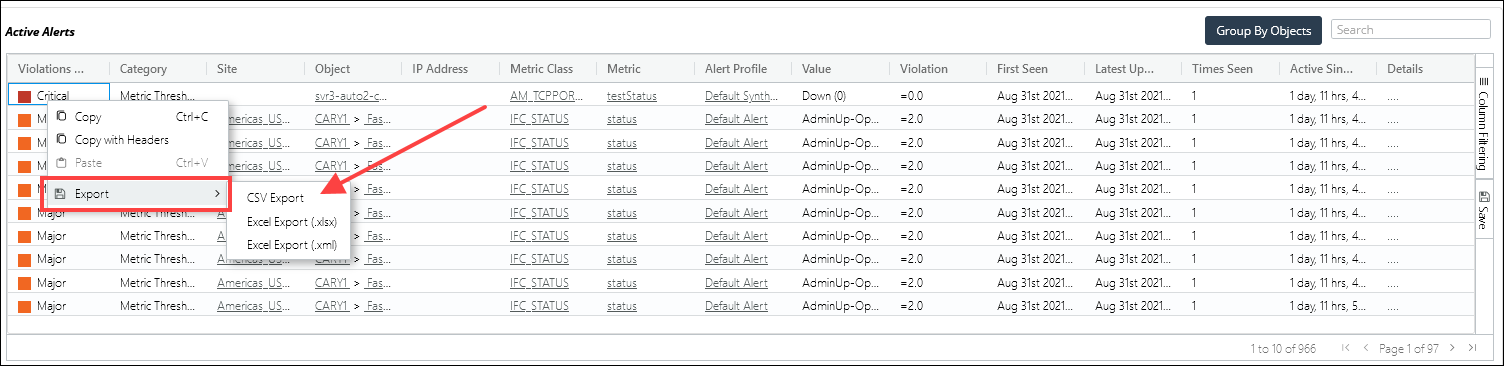
– You can copy and export a selected alert by right-clicking it and using the pop-up menu, as shown in the following screen.
Exporting a selected alert