Monitoring health within the Topology Viewer
In addition to the out-of-the-box default health and default alerts, NetIM allows you to provide your own parameterization for health and default alerts by using the Alerts Profile page, which now has a Health check box for alert profiles that you can use for calculating health. For more information, see
Configuring an alert profile.
The Alerts wizard “Default Alert” and Default Thresholds page continue to control the default alerting and default health calculation. However, the default alerts are now on-crossing as opposed to continuous. This change from previous NetIM releases dramatically reduces the alert count through basic alert suppression and allows you to focus on “What things happened in the last hour” (or time scope of page).
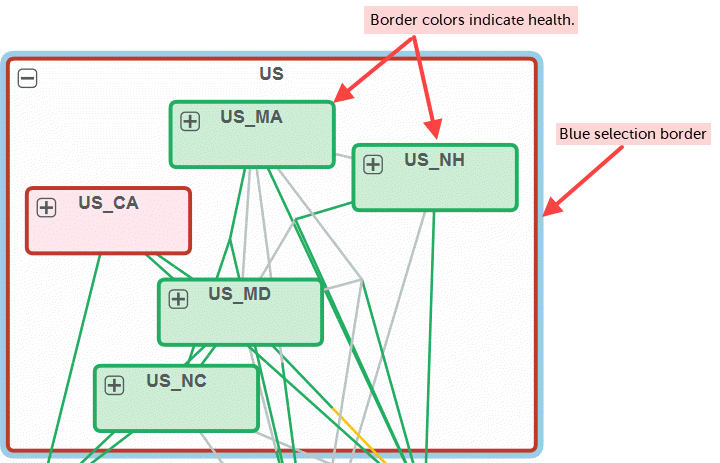
While in the Topology Viewer, you are still monitoring the health of your network. Notice that the health of a group is indicated by the color of the border and the fill. The colors used are the same as the colors indicating health elsewhere in NetIM, making it familiar and easy to detect problems when they occur. In the example below, you are looking at the border for a group. US_NH is a group within the US group. Its green border indicates 100% health. However, notice that the selection border (blue), has a red border within, which indicates at least one of the objects within the US group is down. The group US_CA is red, meaning that the down object is contained in this group. The color of the container and border indicates the health of the least healthy object contained in a given group, as shown in the following screen.
Colors indicating health status of the objects
From the site level, you can drill down to get more health information about children of the parent group. For more information about health, see
Monitoring the Health and Status of Your Infrastructure.
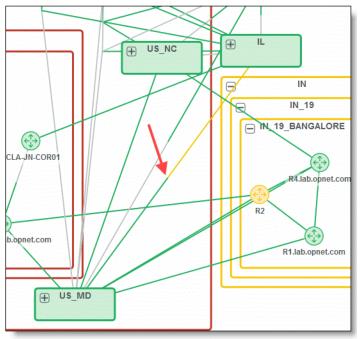
Link coloring also indicates health. In the example shown below, a link from the “IL” group to the “US_MD” group is in a degraded state (yellow). Split health coloring is possible on the link, since each interface has its own health. In the example shown below, the health for the source interface in the IL group is degraded, while the destination interfaces are healthy. Notice the change from yellow to green, indicated by the arrow in the following figure.
Link coloring
When a link represents an aggregate bundle, the color shown will represent the least healthy interface on that side of the bundle of links.