Creating a report
The first time you create a report, NetIM generates the report and formats it for display. When a report is generated, a version of it is cached. If you select the report again during the same web UI session, a cached version of the report is displayed.
To create a report
1. Choose Reports > Network Summary Reports.
The Reports Selection screen appears, as shown in the following figure.
Report Selection screen
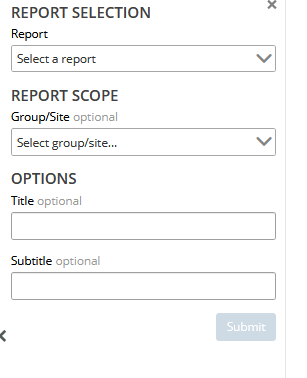
2. For all reports do the following:
The Performance Summary report has additional fields which are described beginning with
step 3.
– Select a report from the drop-down menu.
– (Optional) Select All or a single group/site from the REPORT SCOPE section.
– (Optional) Create a title.
– (Optional) Create a subtitle.
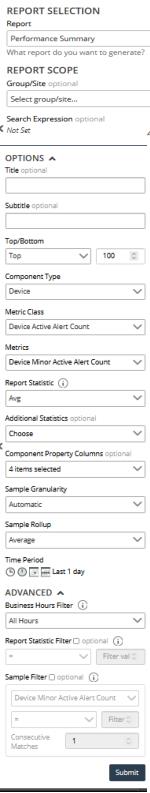
3. If you select the Performance Summary report, you are presented with the following additional options.
Performance Summary options
– (Optional) REPORT SCOPE Search Expression
In addition to group/site scoping, performance reports support the same search by query expression as provided on the Search page, as shown in the following screen.
Search page
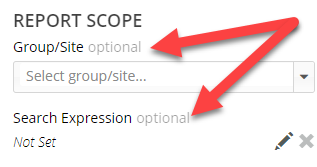
The Performance Reports’ search scoping supports all object type scoping (site, group, device, interface) and attribute scoping, including custom attributes.
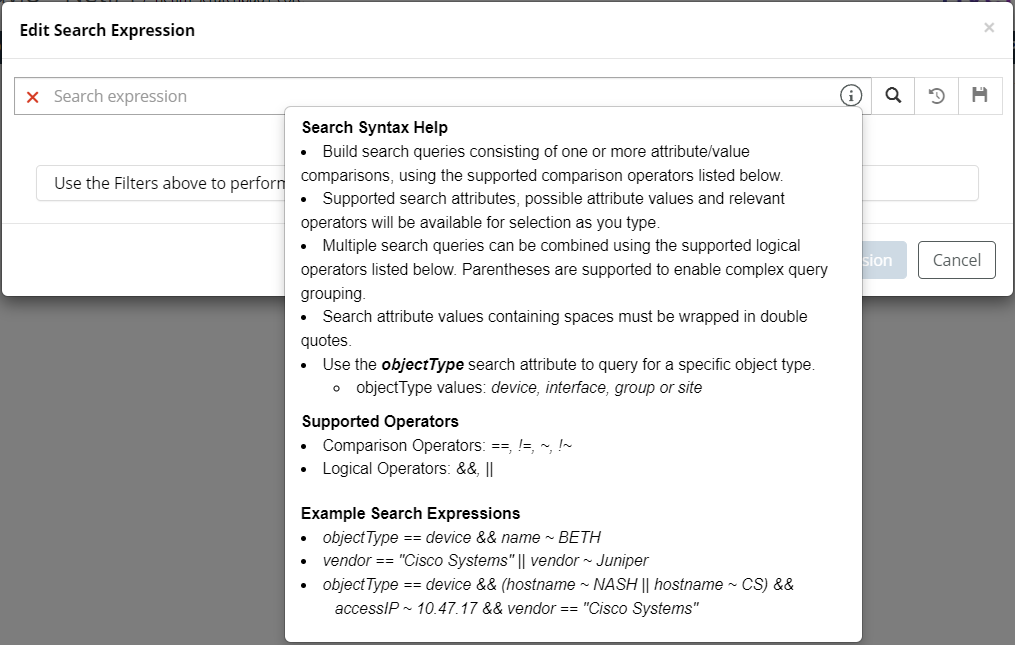
You can also save search expressions to the Search Expressions page and access saved searches from the Search Expressions page. For more information, see
Managing search expressions.With this powerful capability, you can tag interfaces with custom attributes and scope your reports to these interface groups, as shown in the following screen.
Search Expression
– Top/Bottom
Determines how you want the results (1-1000) displayed.
– Component Type
The Component Type selection allow you to select what the subject of the report is going to be: Group/Site, Device, or Interface, as follows:
You answer two questions with Component Type selection:
“What do I want the report to report on – groups/sites, devices, or interfaces?”
“What do I want to aggregate the metrics up to?”
You can construct reports such as device availability aggregated up to a site by appropriate scoping, element type selection, and metric selection.
The Performance Summary report can be applied to many additional component types, in addition to just the NetIM base objects. You first select the component type, then the relevant metric class for that component type, and then the relevant metrics on which you want to report on.
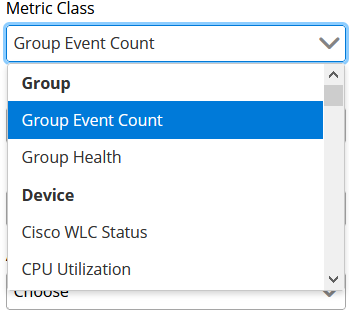
– Metric Class
You select a particular metric class from the following pull-down menu, which determines the metrics presented in the Metrics pull-down menu.
Metric Class options
– Metrics
You can select up to two metrics for inclusion in your report. This is particularly useful for interfaces that have both in and out metrics associated with them.
– Report Statistic
The report statistic is the statistics that will be shown in the report. The representative statistic is the value that should be calculated and displayed in the report, using the individual data samples for the selected time window. The report statistic can be one of:
+ Average of the metric data samples
+ Sum of the metric data samples
* Min of the metric data samples
* Max of the metric data samples
* Count of the metric data samples
* Median of the metric data samples
* 95th Percentile of the metric data samples
* 98th Percentile of the metric data samples
– (Optional) Advanced Statistics
– (Optional) Element Property Columns
Element property columns answers the question, “What columns do I want in my report?” All element attributes are available for you to select including custom attributes.
– Sample Granularity and Sample Rollup
You control the specific metric data that should be used to generate the report when you select Sample Granularity and Sample Roll-up. You are answering the question, “What metric data do I want to use for the report, or do I want to let the report engine decide?”
– Time Period
Determines the time period of the metric collection for the report. The default is last 1 hour.
(Optional) Business Hours Filter
If you select this option you can choose to have the Performance Summary report cover All Hours, Business Hours, or Non-Business Hours. Note that you must have a Business Hours Profile defined and assigned to devices. For more information, see
Setting Time Zones and Business Hours.– (Optional) Report Statistic Filter
The Report Statistic Filter is an optional parameter that allow you to perform thresholding on the data that will appear in the report. Only elements with a report statistic value passing the threshold filter will be included in the resulting report.
– (Optional) Sample Filter
The Sample Filter is applied to filter the samples before calculation of the requested report statistic. You control the data samples that will be used when generating the report with the threshold filters.
4. Click Submit to save the report.
The report is then generated and immediately displays, as shown in the following screen.
Final report
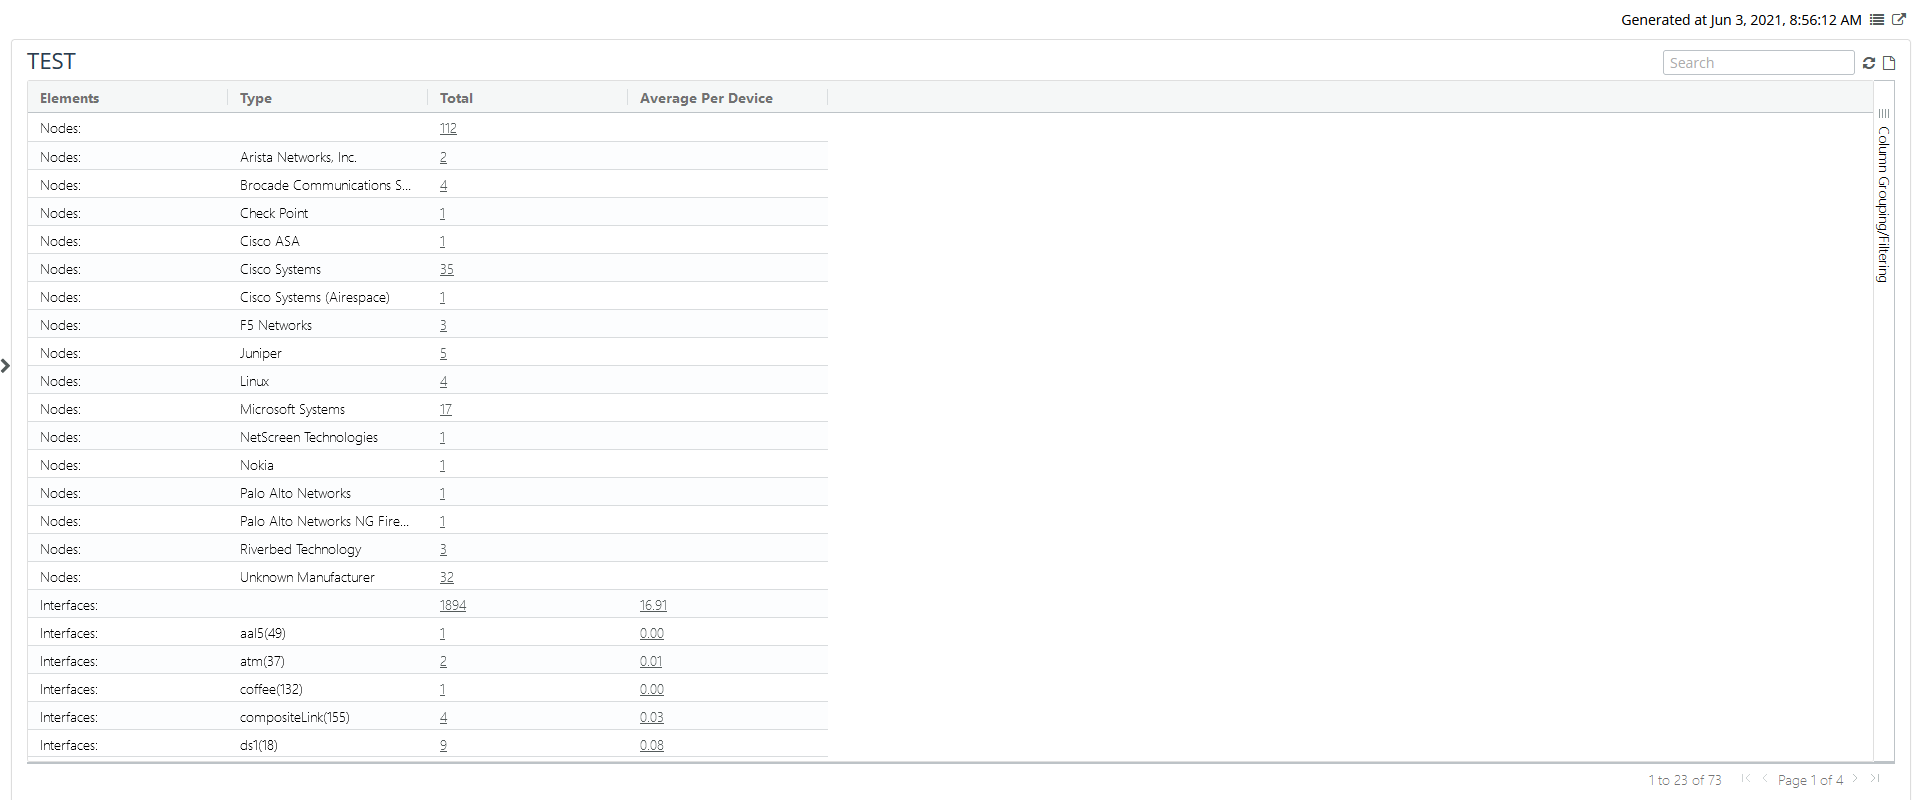
To view all generated reports, click the action menu in the upper-right corner of the report page, which takes you to the Generated Reports page. The Generated Reports page lists all the reports that have been generated, and allows you to run or delete a selected report.
To view the generated report in a separate page, click the arrow icon in the upper-right corner of the Report page.