Working with reports
After a report has been generated as explained in
Creating a report, you can perform the following tasks:
Viewing a report
To view a report, choose Reports > All Generated Reports.
Select a report and then click the arrowhead

icon under the Action column for the selected report to regenerate the report. The generated report displays as follows.
Viewing generated report
Working with report options
You can work with report options as follows:
• Resize individual column
• Click the right border for a column, hold down the mouse button, and drag to the right or left to increase or decrease the width of the column. Release the mouse button when the column header is the desired width.
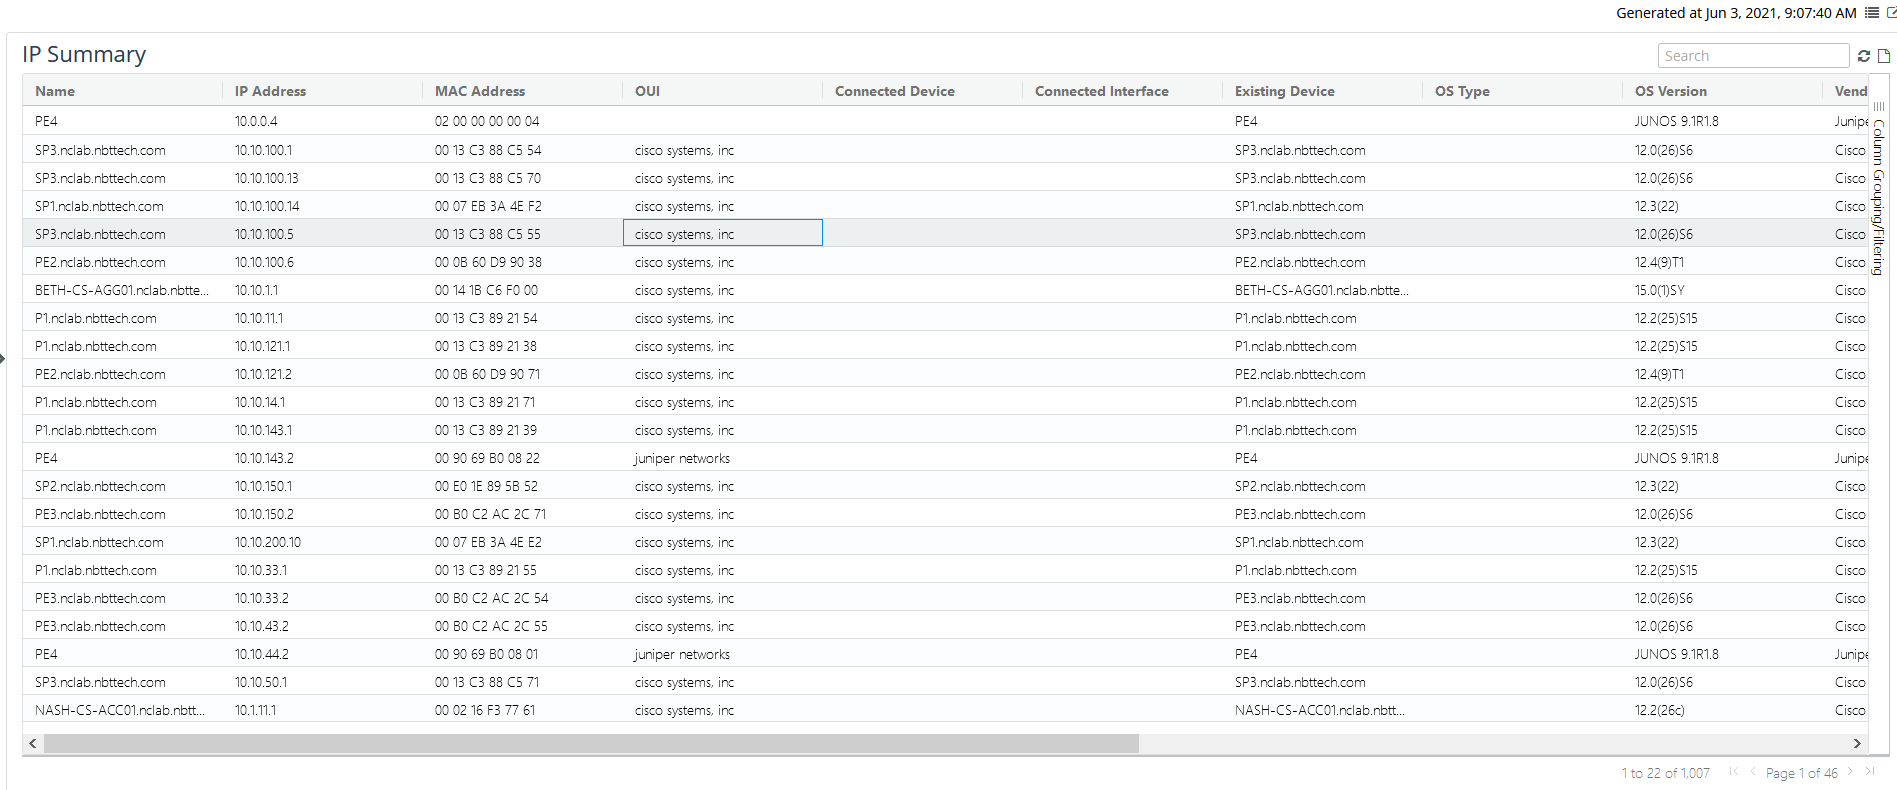
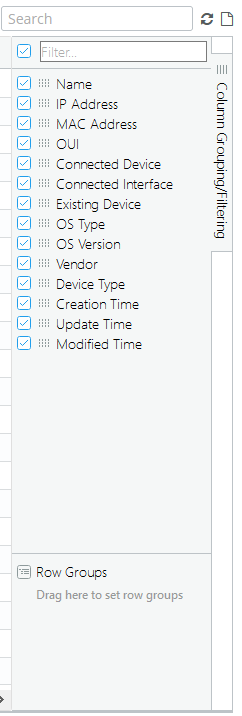
• Display or remove columns
• To display or remove columns, check or uncheck columns in the Column/Grouping Filtering frame, as shown in the following screen.
Column/Grouping filtering
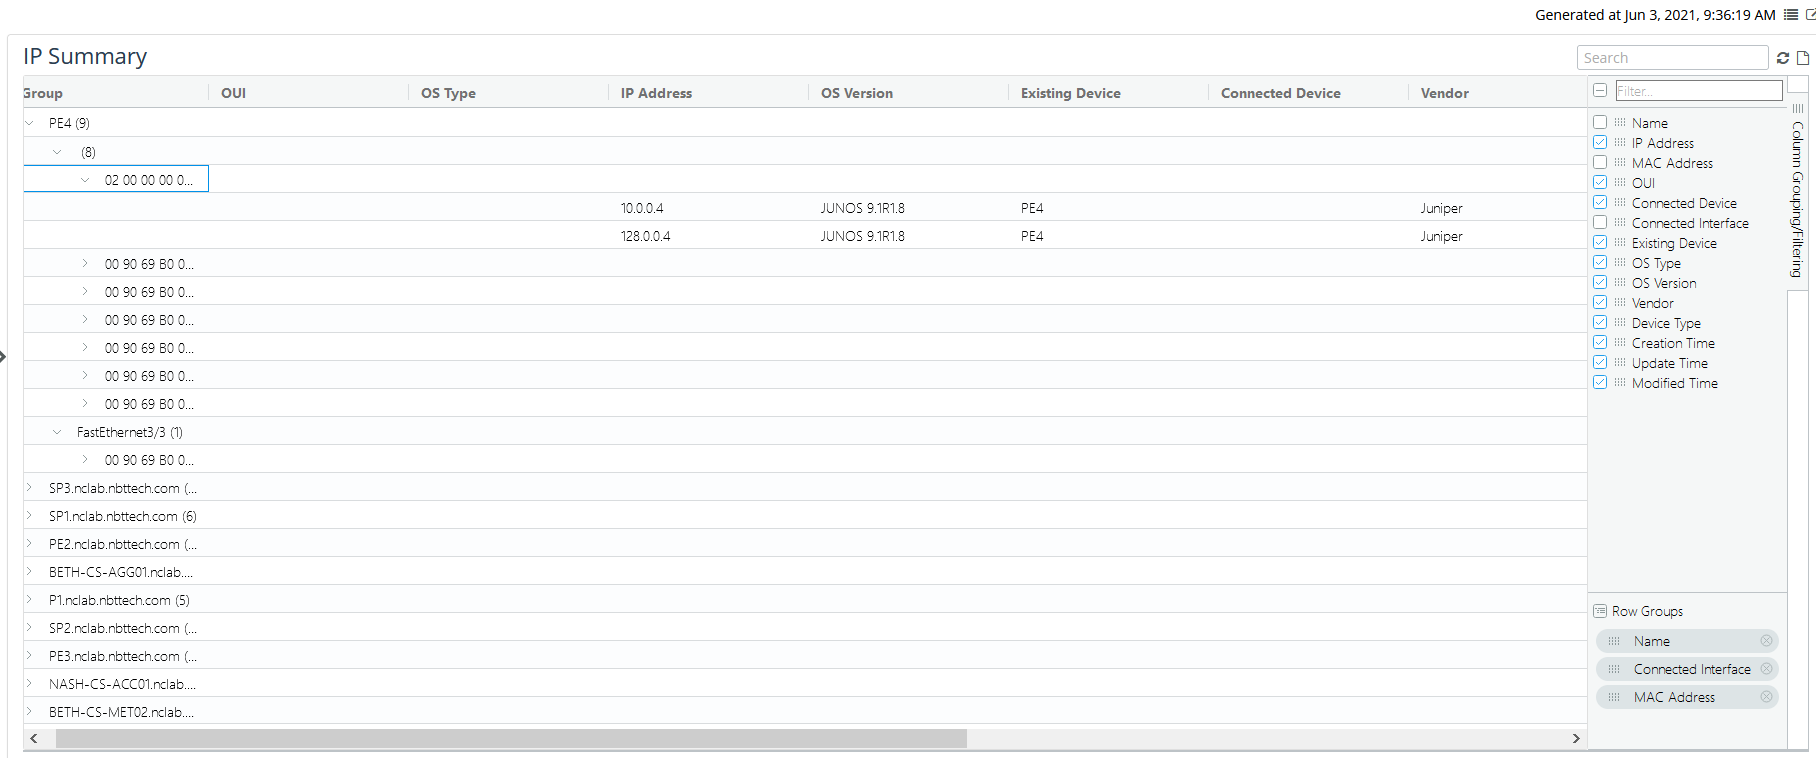
• Add groups to the display
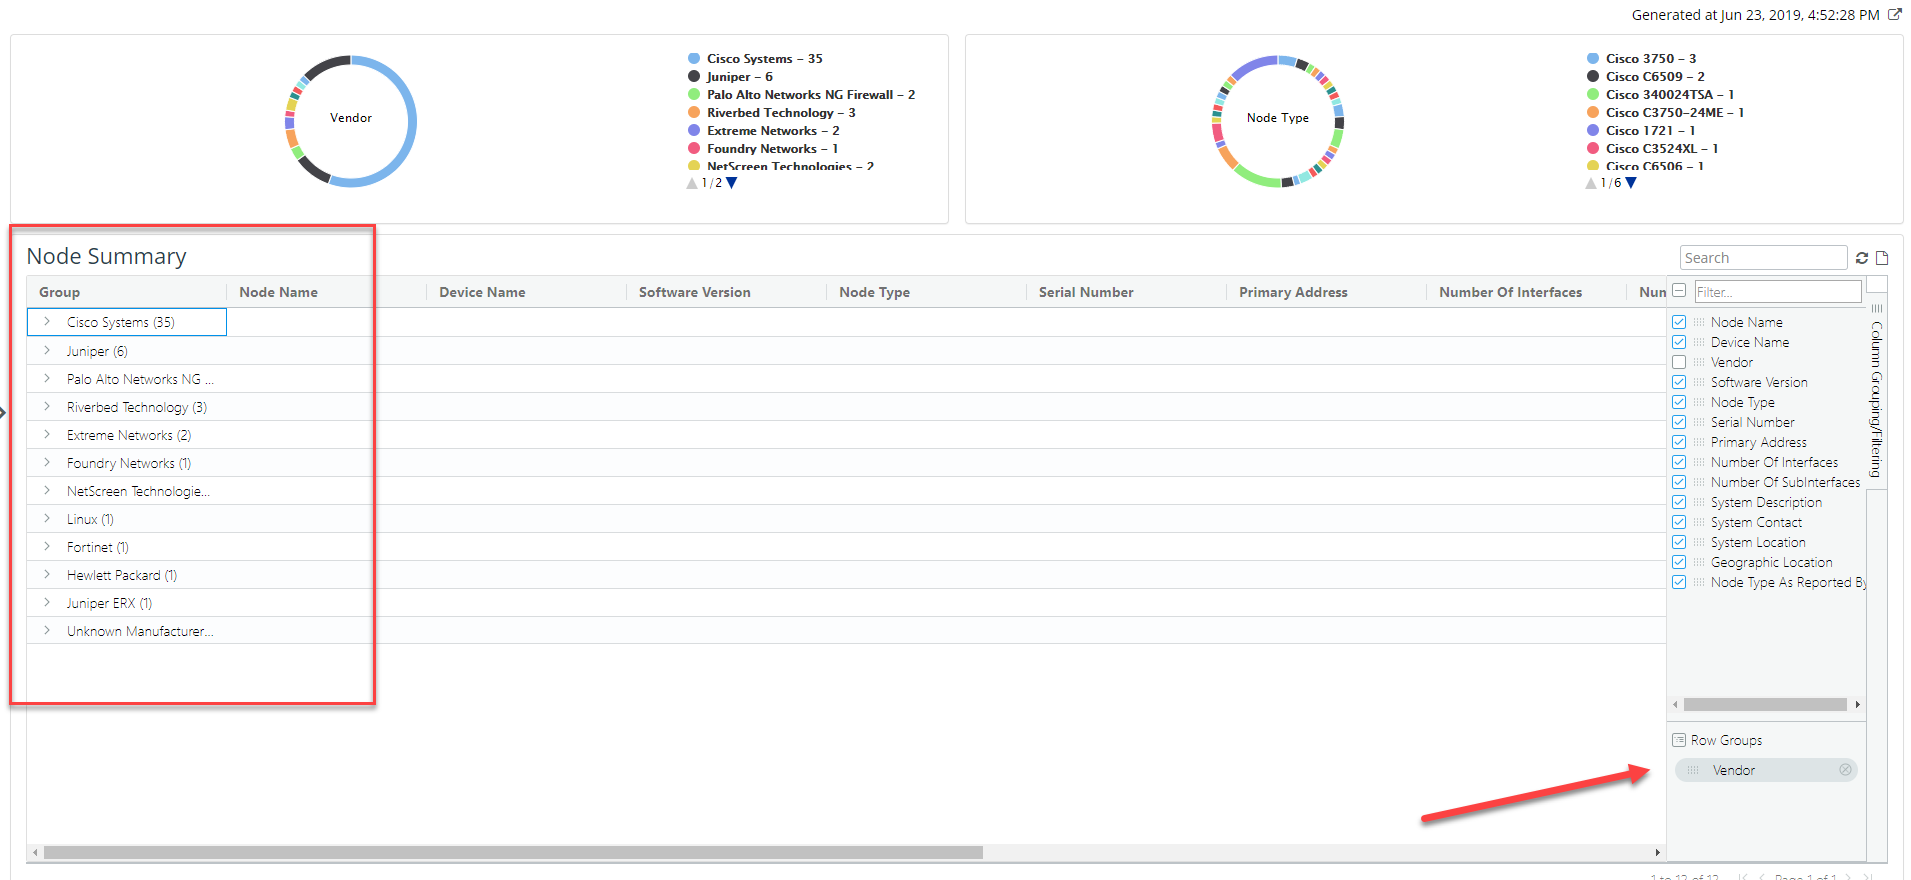
To add telescoped groups to the display, drag headings from the report to the Row Groups section of the Column/Grouping Filtering frame, as shown in the following screen.
Telescoped groups
Column grouping allows you to group or aggregate the content based on specific selected columns. In the following example, the report is grouped by the vendor column which then provides a summary count of each vendor and allows you to expand the contents using a tree-like paradigm.
Column grouping example
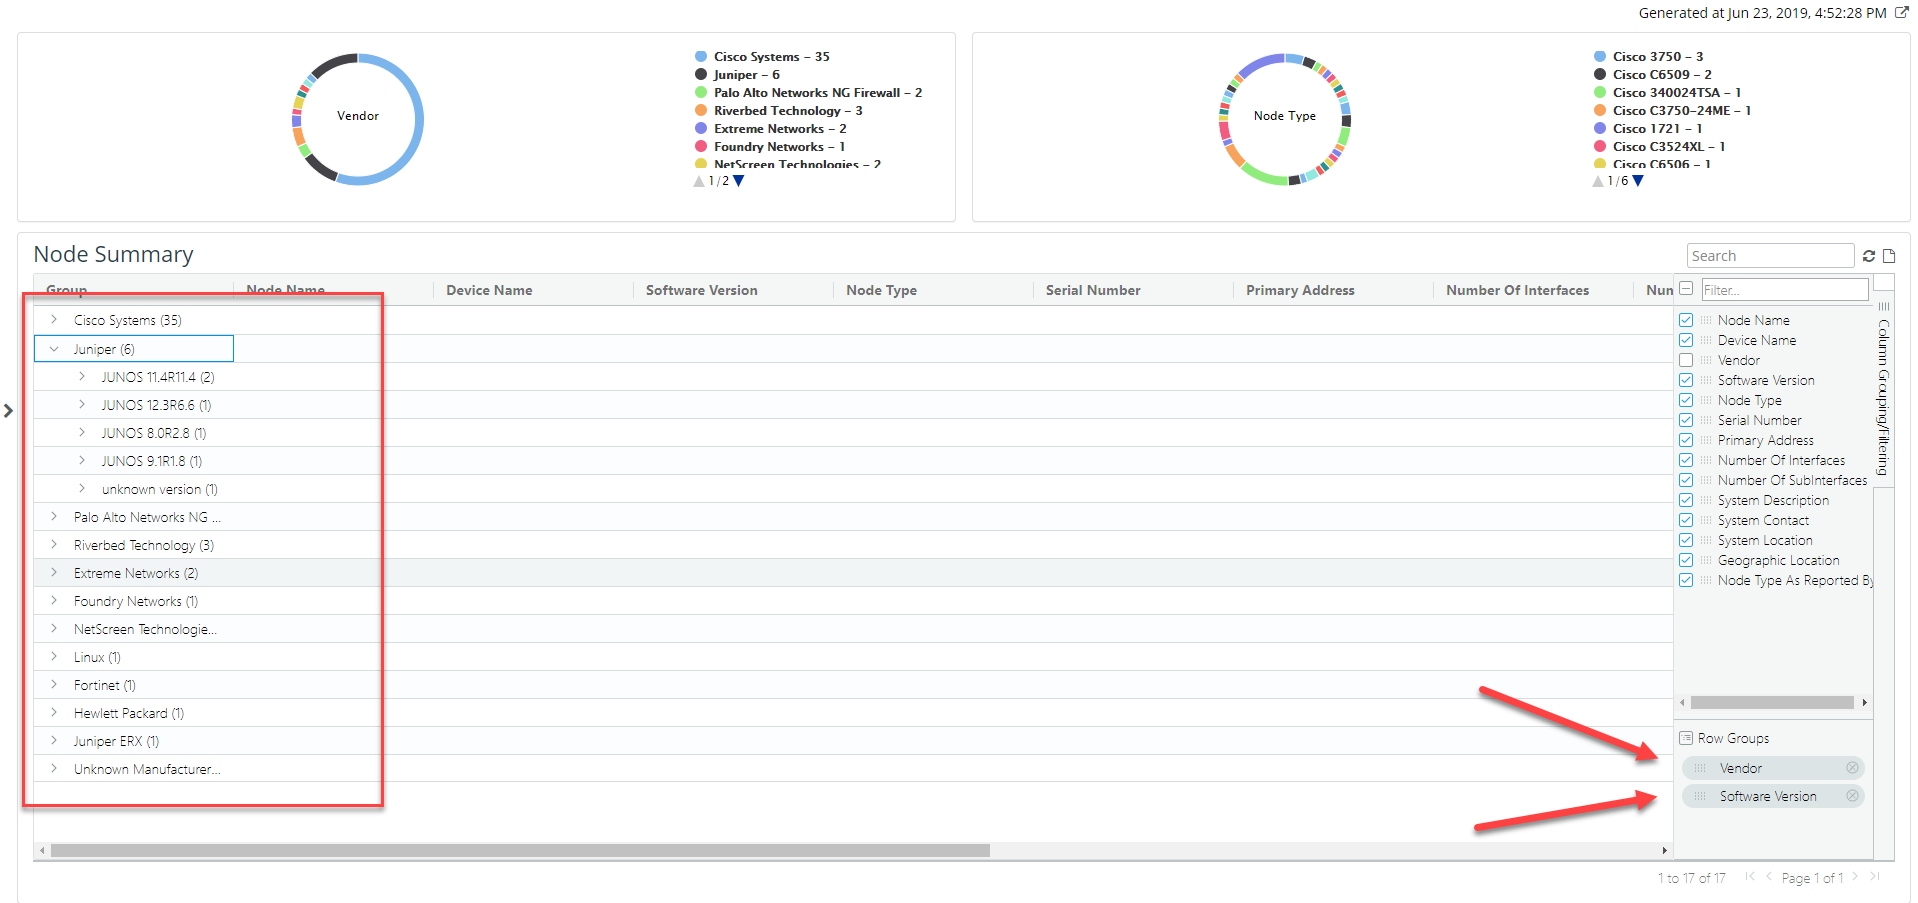
In the following example, vendor and software version are used for grouping so you can sort and view the data first by vendor and then by software version.
Column grouping example
• Increase the report display area
The bar that divides the selection and display areas is movable so you can create more display room.
• Sort data in a column
Click in the column header to sort the data based on that column.
• Regenerate the report
To regenerate the report, click the refresh icon

in the upper right of the report page.
• View the report in a separate page
To view the generated report in a separate page, click the arrow icon

in the upper-right corner of the report page.
• Export the report as a CSV file
To export the report as a CSV file, click the export icon

in the upper right of the report page.
• Search the report
To search the report, enter a string in the search box

in the upper right of the report page.
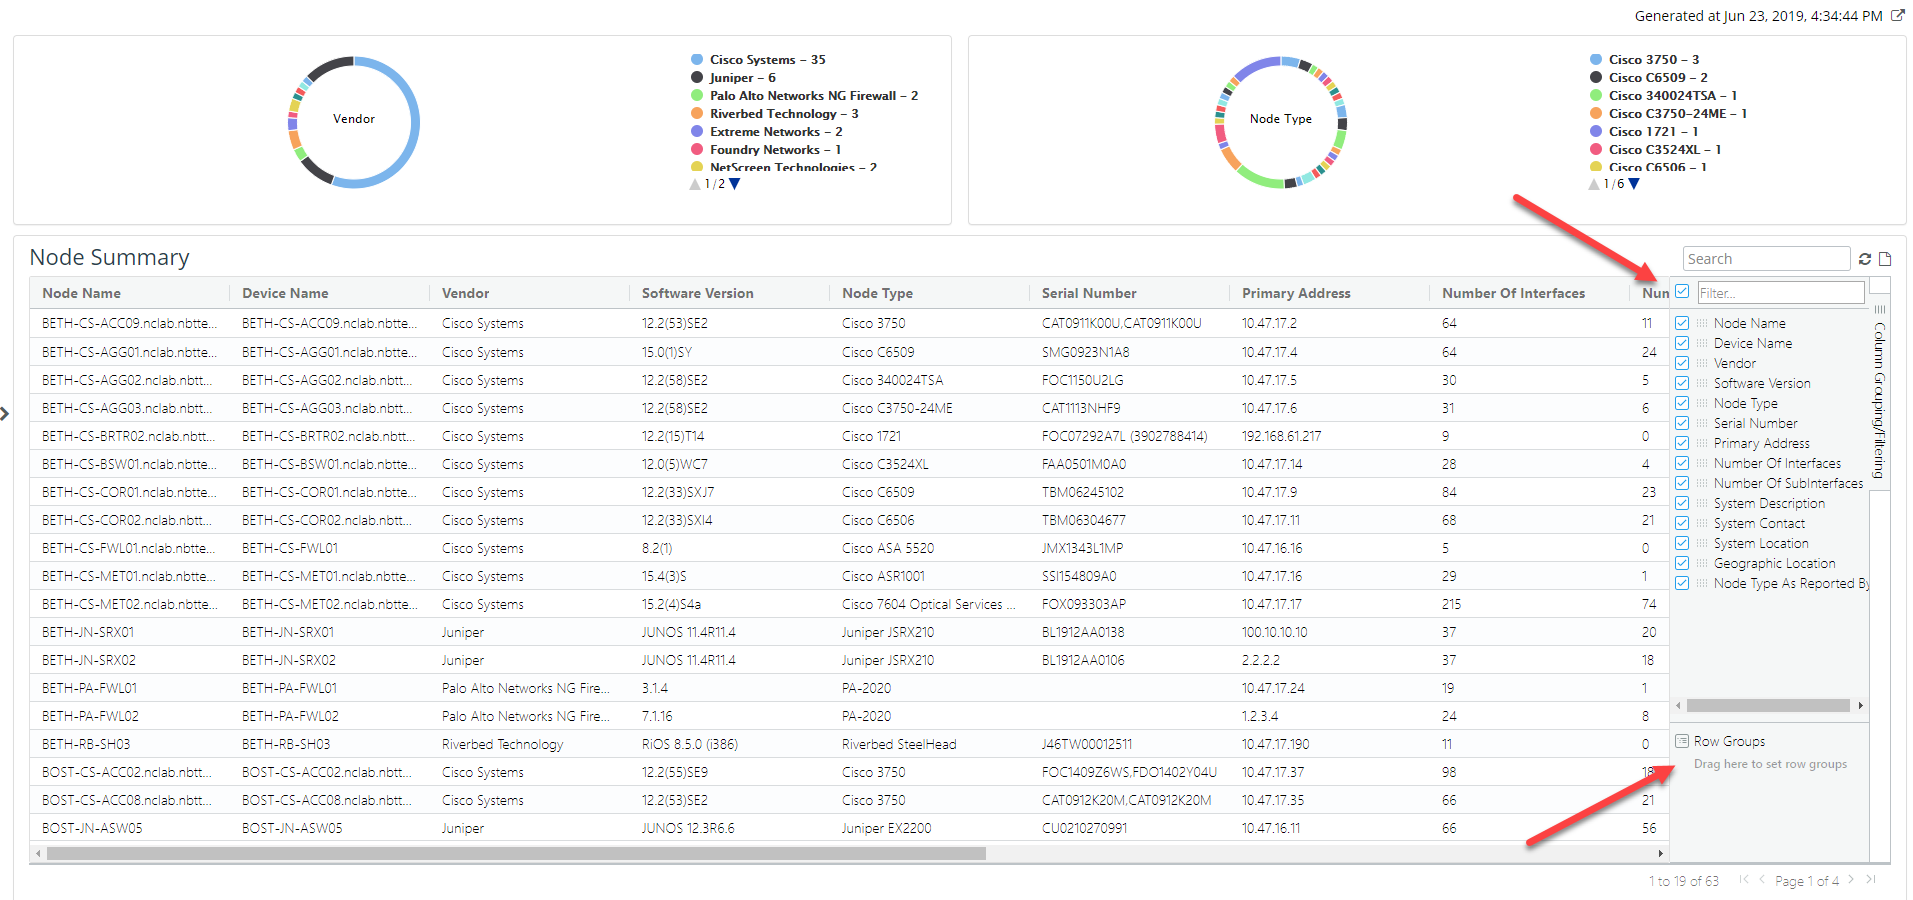
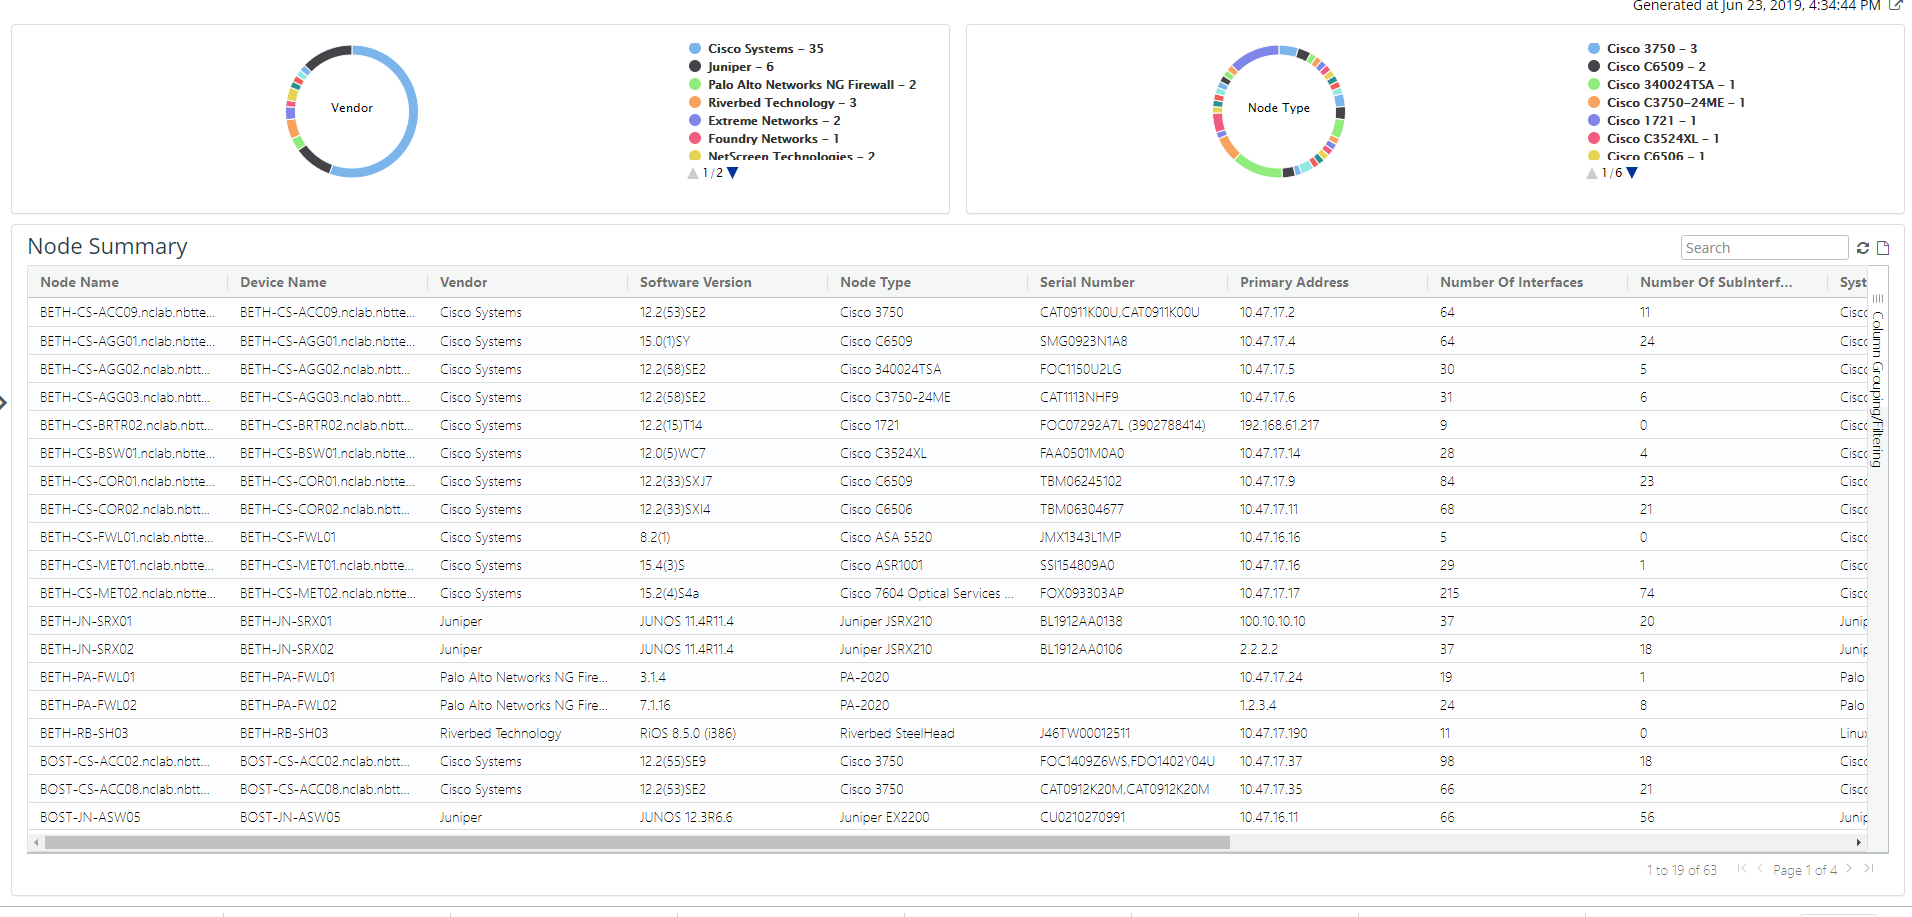
• Pie charts
Many inventory and configuration reports support pie charts that summarize the tabular data by a particular column like vendor and node type, as shown in the following screen.
Pie chart report
The tabular part of the report supports column filtering and column grouping. These controls are present on the right side of the Reports page, as shown in the following screen.
Column filtering and grouping