Navigating the Syslog & Traps view
The Syslog & Traps view can be accessed under Configure > All Settings > Alert: Syslog & Traps, or More > Syslog & Traps. The view consists of two tabs: Counts and Timeline. Syslog & Traps is also available for each device that has the relevant events.
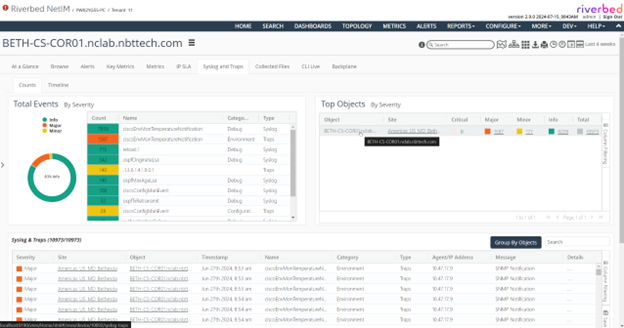
Syslog & Traps view
About the Counts tab
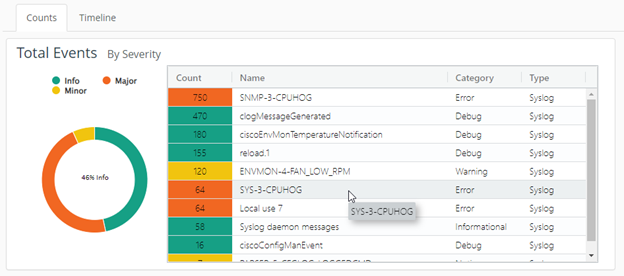
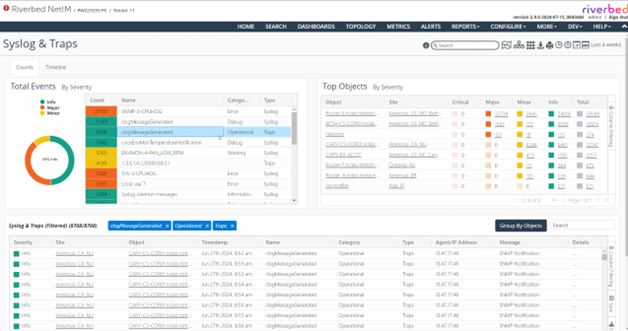
The Counts view provides a detailed view of what types of events are occurring in the system, with counts based on the severity, name, category, and types of events.
Total Events view
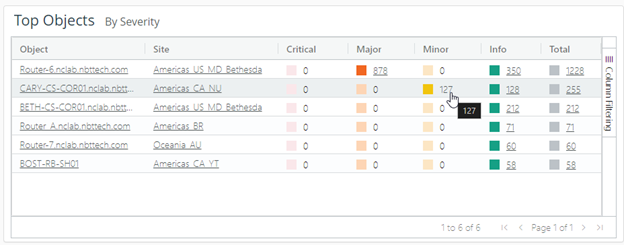
It also provides details on which object in the infrastructure are generating these notification events, along with their severity levels.
Top Objects view
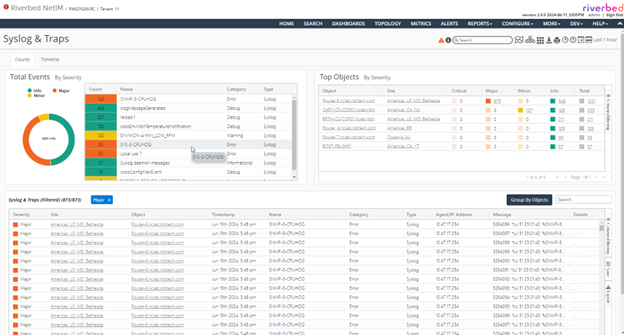
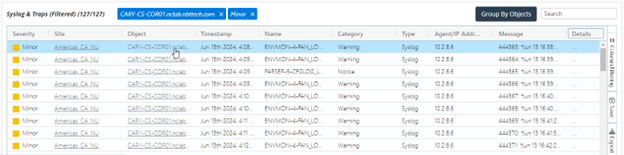
The view is fully interactive with any selections resulting in updates of a detailed table of events at the bottom of the view. This feature can be used to slice and dice the information presented.
For example, clicking the count of Minor events for object Cary-CS-COR01 shown in
Figure: Top Objects view results in the filtered list of events at the bottom of the view.
Events table
Individual rows in the Total Events By Severity can be selected to filter out the relevant events in the events table.
Total Events row selection
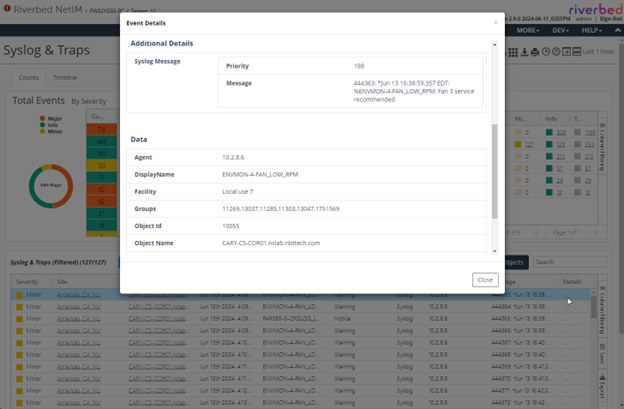
Any details about any of the event can be found by clicking the ellipsis (...) icon in the Details column.
Event Details options
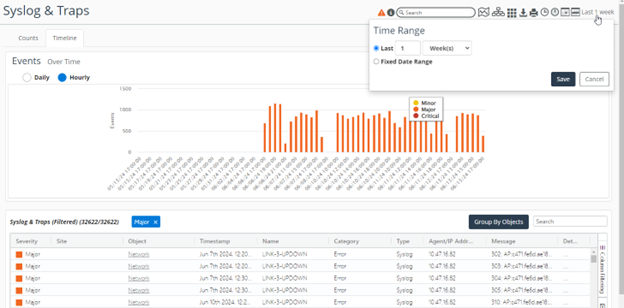
About the Timeline tab
The Timeline view provides more visibility into when the notifications occurred based on their severity. This view can also be used to filter the events based on the time of their occurrence.
Timeline view
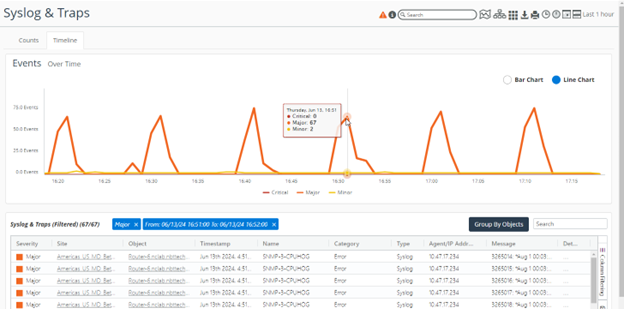
The time selector at the top can be used to display the events for the selected time frame.
Time Range options
About viewing Syslog & Traps per device
You can click any device name in the global events counts and details table to go to the device-specific Syslog & Traps view. This view contains all the information about the events only for that device.
Syslog & Traps view on a device